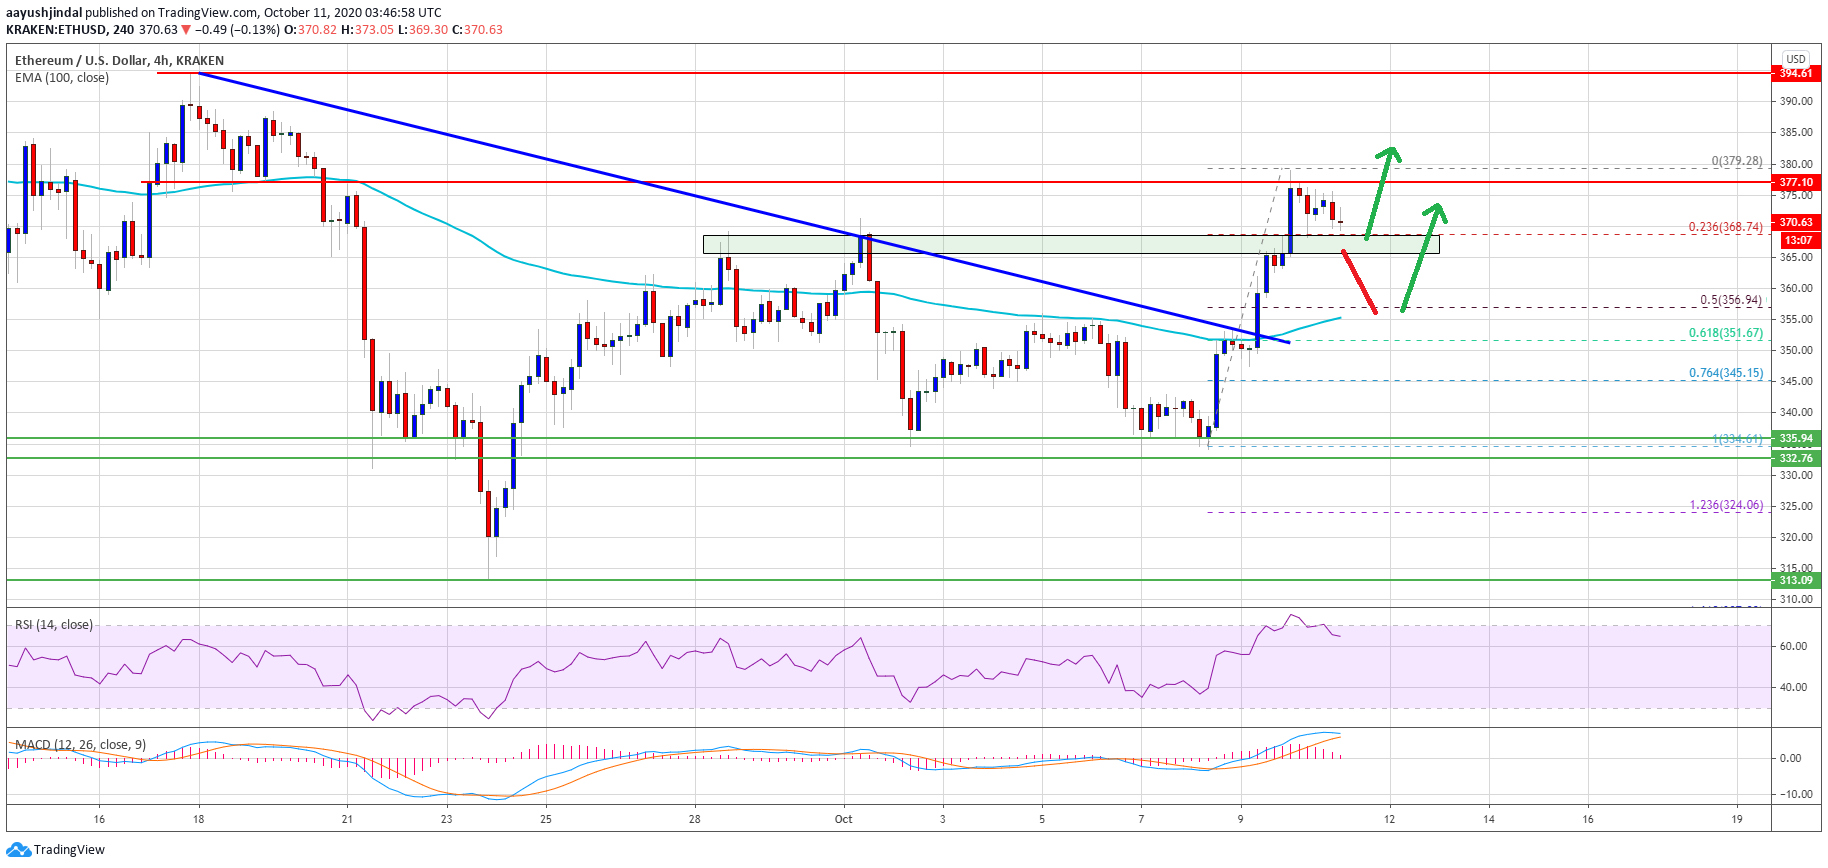
Ethereum started a steady increase above the $355 resistance against the US Dollar. ETH price tested the $380 resistance and it is currently correcting gains.
- ETH price started a strong upward move after it clears the $355 resistance against the US Dollar.
- The price ran into the $380 resistance, but it settled nicely above the 100 simple moving average (4-hours).
- There was a break above a major bearish trend line with resistance near $354 on the 4-hours chart of ETH/USD (data feed via Kraken).
- The pair could correct higher, but downsides might be contained near $355 or the 100 SMA (H4).
Ethereum Price Showing Bullish Signs
After a brief struggle, Ethereum managed to clear a couple of major hurdles near $350 and $355 against the US Dollar. ETH price settled above the $355 resistance and the 100 simple moving average (4-hours) to move into a positive zone (similar to bitcoin above $11,000).
More importantly, there was a break above a major bearish trend line with resistance near $354 on the 4-hours chart of ETH/USD. Ether price rallied over $20 and it even broke the $370 resistance.
It faced a strong resistance near the $380 level (a multi-touch zone). A new monthly high is formed near $379 and the price is currently correcting gains. There was a break below the $375 and $370 level. The first key support is near the $368 level.
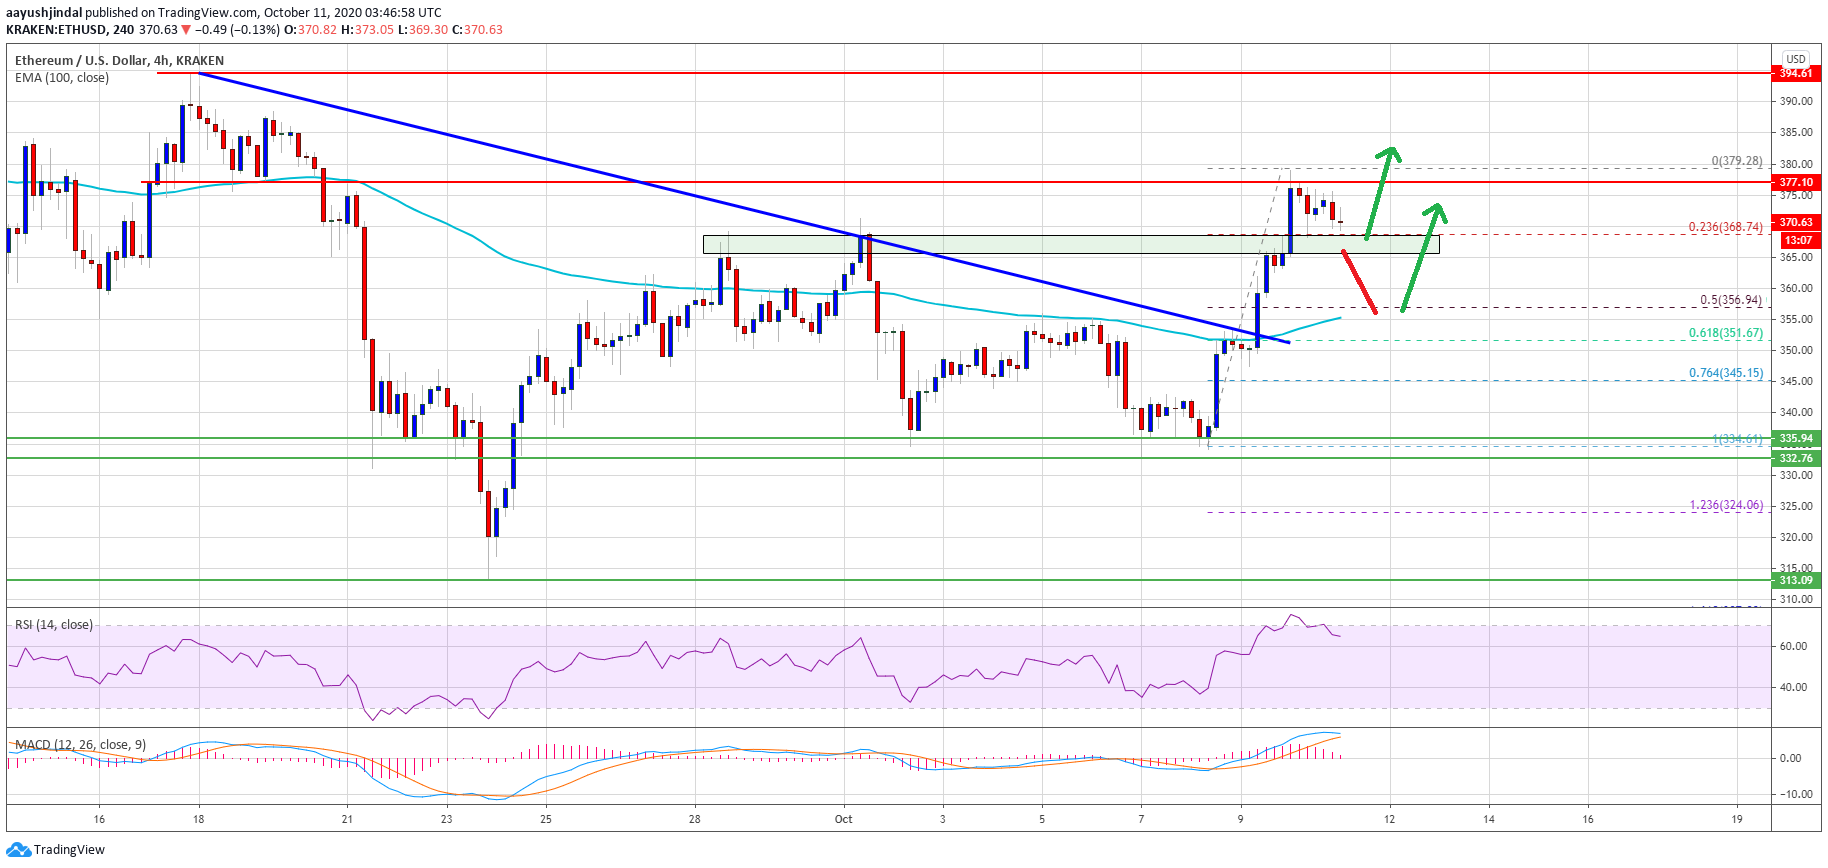
Ethereum price rallies above $370. Source: TradingView.com
The 23.6% Fib retracement level of the recent upward move from the $335 swing low to $379 high is also near the $368 level. If there is a downside break below the $368 support zone, ether price is likely to continue lower towards the $355 support.
On the upside, the $380 level is another breakout zone. A clear break above the $380 resistance is likely to clear the path for more gains towards the $395 and $400 resistance levels in the coming sessions.
Dips Supported in Ether (ETH)?
If Ethereum fails to clear the $380 resistance zone, it might start a downside correction. An initial support for the bulls is near the $368 level.
The main support is now forming near the $355 level (the last breakout zone) and the 100 simple moving average (4-hours). The 50% Fib retracement level of the recent upward move from the $335 swing low to $379 high is also near the $356 level to provide support.
Technical Indicators
4 hours MACD – The MACD for ETH/USD is slowly losing pace in the bullish zone.
4 hours RSI – The RSI for ETH/USD is now well above the 60 level.
Major Support Level – $368
Major Resistance Level – $380
For more such news and updates , read only at Buyucoin !


