Ethereum topped near the $370 resistance and declined sharply against the US Dollar. ETH price is showing bearish signs below $355 and it might continue to move down.
- ETH price started a fresh decline after it failed to clear $370-$375 against the US Dollar.
- The price is now trading below the $355 support and the 100 simple moving average (4-hours).
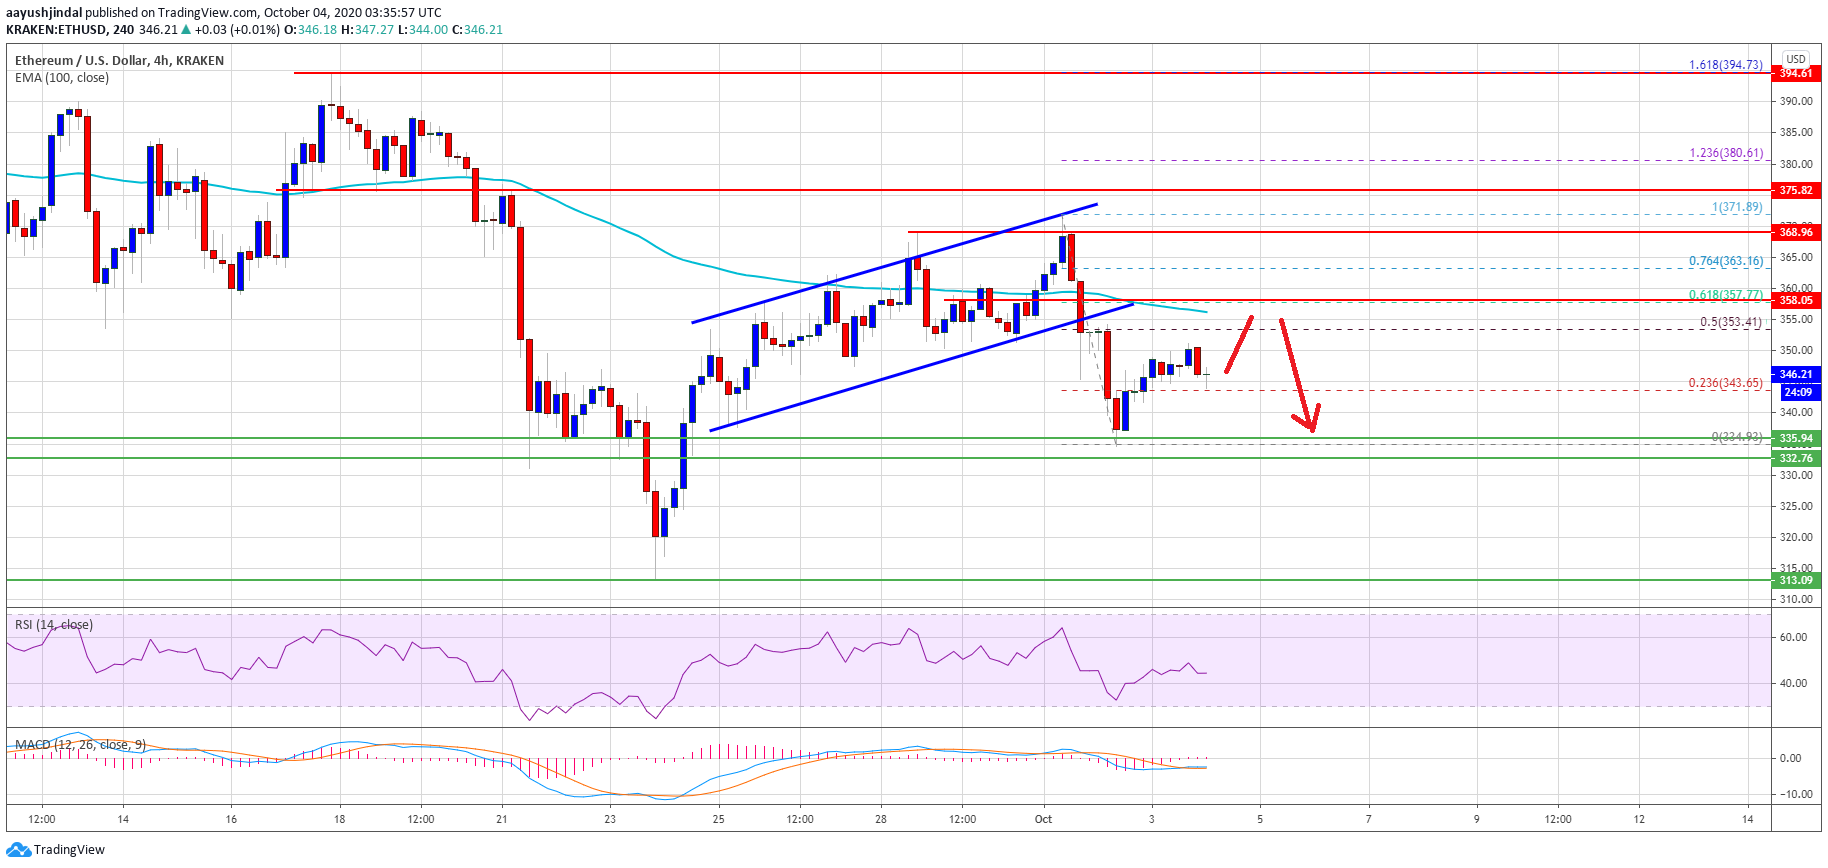
- There was a break below a major ascending channel with support near $355 on the 4-hours chart of ETH/USD (data feed via Kraken).
- The pair could correct higher, but upsides might be capped near $355 or the 100 SMA (H4).
Ethereum Price Breaks Key Support
This past week, Ethereum surpassed the $355 and $360 resistance level against the US Dollar. However, ETH price failed to gain bullish momentum above the $370 and $375 resistance levels.
A high was formed near $372 and ether price started a sharp decline. It broke the $355 support level and the 100 simple moving average (4-hours) to move into a negative zone. There was also a break below a major ascending channel with support near $355 on the 4-hours chart of ETH/USD.
The price tested the $335 support zone, where the bulls took a strong stand. Recently, there was an upside correction above the $340 level. Ether traded above the 23.6% Fib retracement level of the downward move from the $372 high to $335 swing low.
Ethereum price settles below $355. Source: TradingView.com
On the upside, there are many important hurdles for the bulls starting with $353. It is close to the 50% Fib retracement level of the downward move from the $372 high to $335 swing low.
The main resistance is near the $355 level and the 100 simple moving average (4-hours), above which the price might start a steady upward move towards $370 or even $380 in the coming days.
More Downsides in Ether (ETH)?
If Ethereum fails to clear the $355 resistance zone, it might start a fresh decline. An initial support on the downside is near the $340 level.
The first major support is near the $335 level. If ether fails to stay above the $334 support, there is a risk of a sharp decline towards the next major support at $315 or $310. Any further losses could the price towards the $300 support.
Technical Indicators
4 hours MACD – The MACD for ETH/USD is slowly moving into the bullish zone.
4 hours RSI – The RSI for ETH/USD is now well below the 50 level.
Major Support Level – $335
Major Resistance Level – $355


