FOMO has returned to the crypto market in a major way, now that Bitcoin has set a new all-time high price record.
But as more buyers pile in after an already nearly 200% rally in 2020, indicators are reaching extreme readings of overbought conditions, that nearly every time in the past has resulted in a strong correction. Here’s why this time won’t be different, and why the leading cryptocurrency by market cap is overdue for a steep correction.
FOMO Reaches Frenzy Level As Bitcoin Sets New All-Time High
Bitcoin is now back on nearly everyone’s radar. The cryptocurrency is making headlines on mainstream media outlets everywhere, celebrities are getting in on the action, and institutions and hedge funds are quietly absorbing as much of the supply as they can.
“Smart money” has been loading up on Bitcoin over the last two to three years of bear market and holding for the eventual post-halving bull run that’s long been anticipated.
Related Reading | Search Engine Marketing Data Reveals Highest Retail Interest In Bitcoin Ever
BTC moving off of exchanges post-Black Thursday was the first sign markup was coming, and once $10,000 was taken out, the trend picked up in steam. From the retest of $10,000 to nearly $20,000 took only three full months, leaving a trail of thirteen consecutive green three-day candles behind.
Even retail FOMO has begun to return crypto, but all the buying has resulted in extremely overbought conditions, according to the Relative Strength Index.
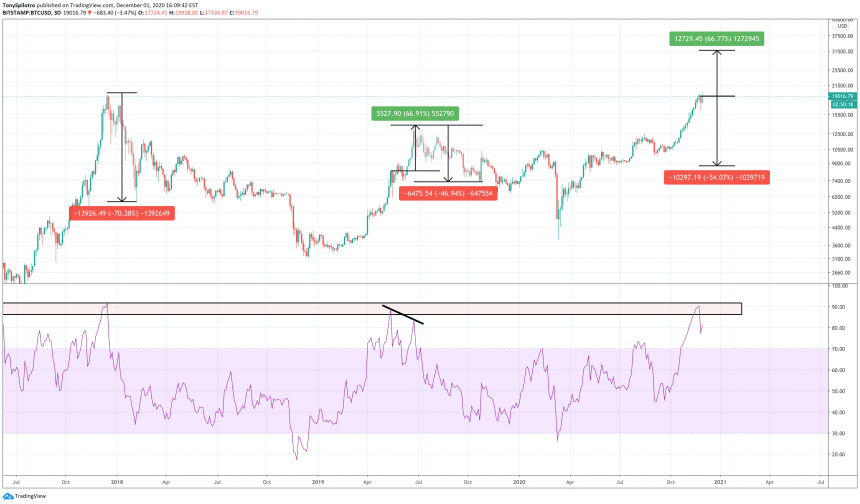
Bear market corrections when the RSI becomes so overbought result in an average drop of over 50% | Source: BTCUSD on TradingView.com
Relative Strength Index: Overbought Conditions Reach Extreme, Correction Always Follows
When examining the timeframe that had the most consecutive green candle closes, the three-day Relative Strength Index very clearly shows just how overbought Bitcoin is currently. It also explains why a massive correction in crypto is largely overdue.
The RSI reached such a peak at the 2017 high, resulting in an immediate 70% decline and kicked off the bear market. The indicator also became that overheated, however, in May 2019, but didn’t the cryptocurrency didn’t top out until a full five-weeks later when a bearish divergence formed.
Bitcoin price first rose another 66% before the divergence confirmed and the asset ultimately broke down, wiping out 46% from its tag.
Related Reading | Bitcoin Indicator Reaches Historical Extreme: Price Sheds Two Thirds Upon Reversal
That small snapshot of price action suggests that there are two scenarios: a sharp correction here, or another ridiculous run to $31,000 before a short-term downtrend cuts as much as 58% off current levels.
The bottom target could be as low as $8,000 in that scenario. As unlikely as it may be, the average correction from the last two bear market peaks confirms the possibility is plausible based on the data alone.
But this is now a bull market, not a bear market, and that could change things. Zooming out for a larger sample size and including the previous bull market, there were five total times the three-day chart reached such overbought conditions, and just like the bear market, each led to a correction.

Bull markets, however, only correct around 37% on average | Source: BTCUSD on TradingView.com
Four out of the five “tops” sent the leading cryptocurrency by market cap plummeting down as much as 40% at the largest of drops – nowhere nearly as devastating as bear market corrections.
The average of the bunch, suggests that the current correction could end up at roughly 37%, as other analysts have concluded based on past corrective phases.
There was one other instance where a bearish divergence formed similarly to the 2019 peak, but in the previous instance, the cryptocurrency only rallied about 30% further.
Data doesn’t lie, and this time is no different than any other situation, any other asset. The Relative Strength Index was designed to visually signal when assets have reached overbought conditions, and that is exactly the current tell.
There is no question a correction is coming, Bitcoin bull market or not. The only question is when, and according to historical recurrence, the probabilities of the top already being in are high – but a divergence and another $10,000 move isn’t outside the realm of possibility.
Because of what’s at stake – potentially a rise or fall of roughly 50% – get ready for an unpredictable, wild ride where the outcome no matter what is a correction eventually.
Featured image from Deposit Photos, Charts from TradingView.com

