PSA: Few Days Remain For XRP Holders To Claim Spark Tokens, Here’s How

XRP has a major bullish breakout recently, resulting in an over 200% rally. And while bullish technicals had been building, it…

XRP has a major bullish breakout recently, resulting in an over 200% rally. And while bullish technicals had been building, it was the Flare airdrop and promise of free Spark tokens that helped propel Ripple to current levels.

The Flare airdrop “snapshot” of the XRP ledger takes place at the end of this week, leaving only a few days left to prepare your wallet and claim the airdropped Spark tokens. Are you ready and prepared for the airdrop? If not, here’s how.

Ripple Effect: Why The Flare Airdrop Helped Trigger The Massive XRP Breakout

XRP investors have had a more painful bear market than most other crypto investors, suffering through three years in a row of the worst performance across the market.

With each subsequent low in Ripple, the army of investors began to fold. Those who were able to hold on, however, have been rewarded well with a surprise 200% rally in Q4 2020.

Related Reading | Underdog Story: Why XRP Could Soon Outperform Bitcoin And Ethereum

In addition to the bullish momentum and resulting ROI, Ripple holders can also claim an equal amount of Spark tokens as part of Flare Network’s upcoming airdrop. The allure of free tokens only accessible by holding XRP, was part of what sent the altcoin soaring recently.

But with all the commotion and focus on Ripple, investors don’t want to miss out on their free tokens, in which there are only three days left to get set up.

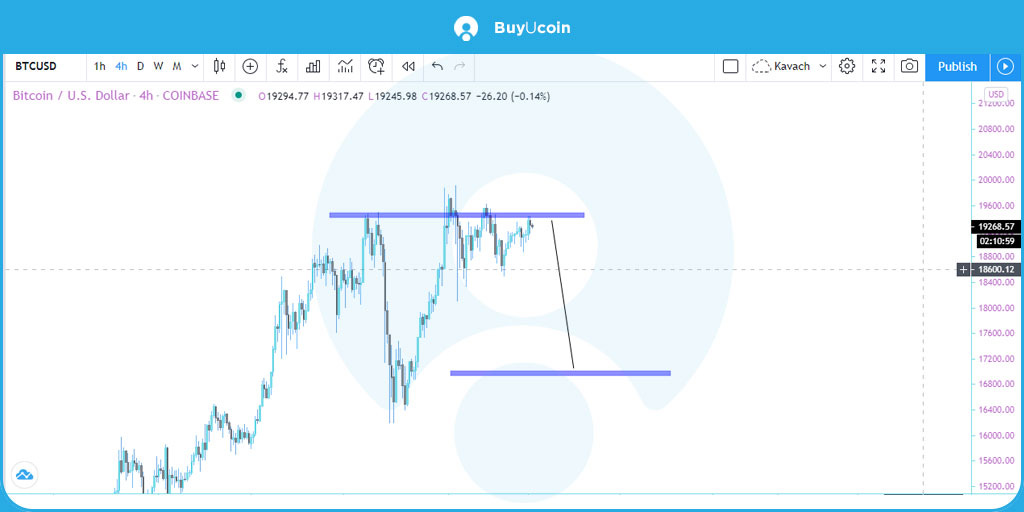
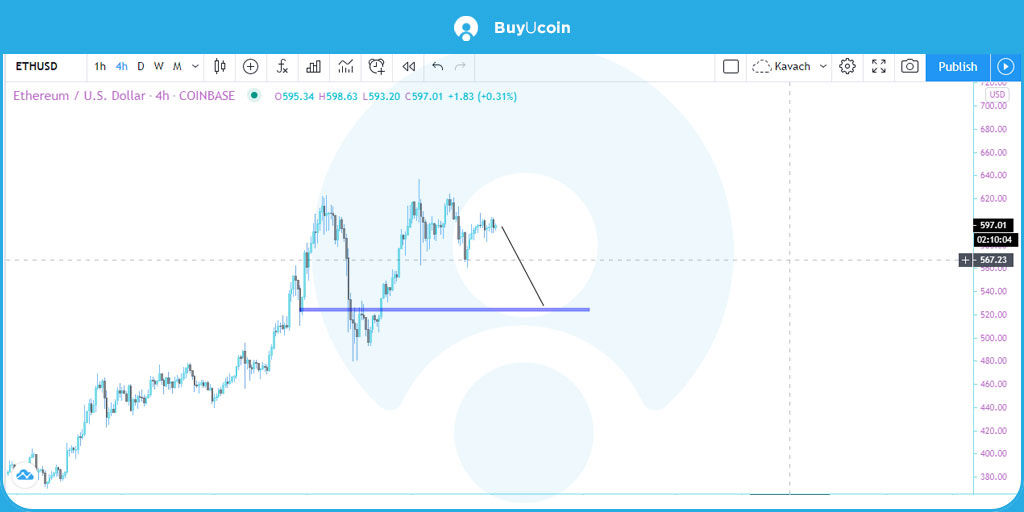
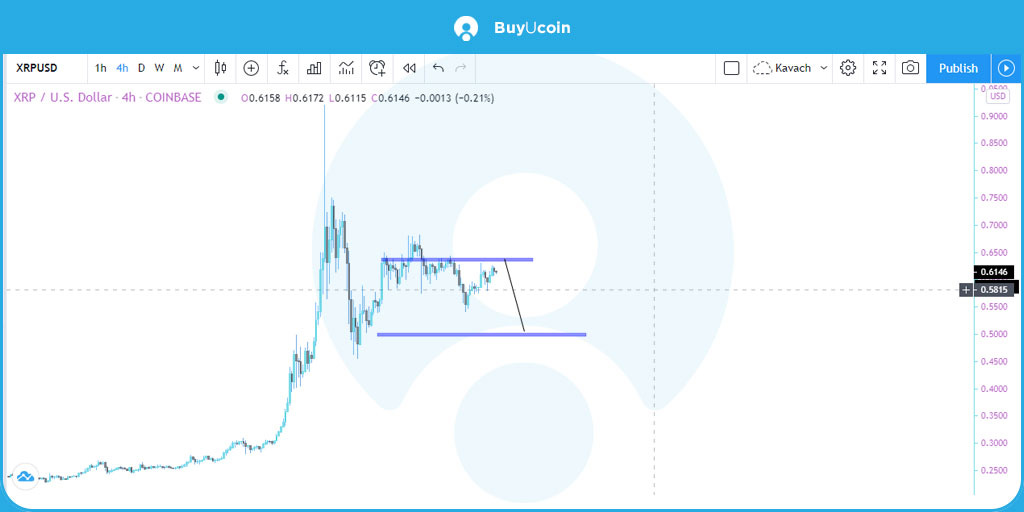
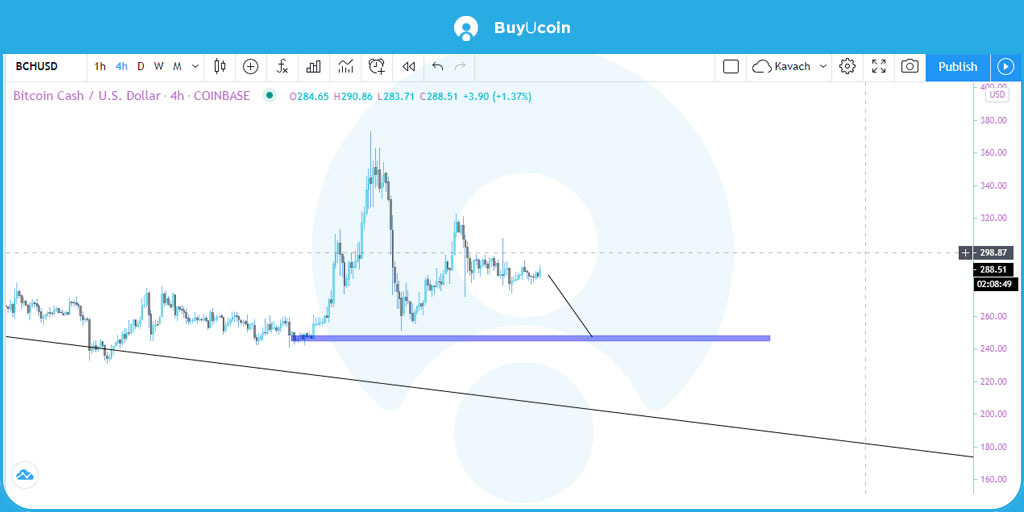
Bullish chart patterns and technical indicator signals suggested Ripple would rise | XRPUSD on TradingView.com

How To Claim Spark Tokens From Crypto Exchanges Or Through Self-Custody

The Flare Network leverages the XRP ledger but brings in Ethereum smart-contracts in order to run DeFi applications on the Ripple-created protocol.

To claim Spark tokens, the easiest way possible is by keeping XRP stored on any of the cryptocurrency exchanges that support the Flare Network airdrop. These include Binance, Bithumb, Bitfinex, eToro, Crypto.com, FTX, Huobi, Kraken, OKEX, KuCoin, and even straggler Coinbase, which users feared would miss the cut off.

The full list of supported exchanges is available on the Flare website and can be seen below, updated as of December 4. Each exchange will handle it all for you and at some point release the Spark tokens to investors who held Ripple at the time of the snapshot.

The current list of exchanges supporting the Spark token airdrop | Source: Stedas HR

It is worth noting, however, that anyone interested in participating in the airdrop through any of the supported exchanges must pay close attention to the details associated revealed. For example, Coinbase doesn’t plan on giving users any Spark tokens until an unspecified “later date” and reminds everyone that the tokens are first subject to regulatory scrutiny.

Essentially, there’s a chance you don’t get Spark tokens at all from the supporting exchange, despite their participation in the airdrop. In the end, this ultimately comes down to each region’s regulators and is a reminder of the whole “not your keys, not your crypto” quote that is too often overlooked.

Related Reading | Ripple CEO Says U.S. Regulators Are Holding Back XRP’s Potential

To ensure ownership over any Spark tokens, it starts with taking full ownership of XRP in a wallet you self-custody. Users must also ensure they have access to a non-exchange Ethereum address.

The remaining steps have been graciously outlined by “Wietse” who is an XRP supporter and developer, and include visiting XRPtoolkit.com with a Ledger Nano connected to interact with the ledger and claim the tokens.

After the snapshot date of December 12, 2020, at 00:00 AM UTC, Spark tokens will available for claiming.

Featured image from Deposit Photos, Charts from TradingView.com

Chainlink Shows Signs of Weakness Against BTC as Price Slides Lower

Chainlink has been closely tracking the aggregated cryptocurrency market throughout the past few days and weeks This has caused it to…

  • Chainlink has been closely tracking the aggregated cryptocurrency market throughout the past few days and weeks
  • This has caused it to see some notable consolidation, as well as some slight downside throughout the past 24-hours
  • The main source of selling pressure on LINK’s price has been the weakness seen across the aggregated market
  • ETH and BTC have both been struggling to maintain their multi-week uptrends, which is leading investors to flee higher-risk assets like altcoins
  • This has put some pressure on LINK’s technical outlook, especially against its Bitcoin trading pair
  • One analyst is noting that there’s a strong possibility that it sees significantly further downside in the days and weeks ahead

Chainlink has been closely tracking the entire market, which has caused it to see some technical weakness as bulls fail to hold it above multiple key support levels.

The crypto market, in general, has seen some weakness as of late, which comes as Bitcoin continues struggling to break above its crucial $19,400 resistance level that is widely seen as the last key resistance before $20,000.

Its recent break below $19,000 has compounded this weakness and caused altcoins like Chainlink and Ethereum to all turn lower.

One trader is now expecting Chainlink to decline in value against Bitcoin in the near-term, which could mean that serious losses are imminent regardless of whether or not BTC breaks out or breaks down.

Chainlink Struggles to Gain Momentum as Selling Pressure Mounts

At the time of writing, Chainlink is trading down just over 4% at its current price of $12.51.

This is around where it has been finding serious buy-side support throughout the past few days, which may ultimately become a strong base for it to grow upon if it continues holding strong.

Trader Claims LINK is Likely to Lose Value Against Bitcoin

There is a common notion that altcoins risk comes from their ability to lose value both while Bitcoin is running and while it is plunging.

As such, there’s a possibility that Chainlink will lose value against BTC regardless of where the benchmark crypto trends next – a possibility mused by an analyst in a recent tweet.

“LINK: Good luck with the btc pair. Many alts across the board with better rounded structures.”

Image Courtesy of Chainlink. Source: LINKUSD on TradingView.

The coming few days should shine a light on this possibility and how Bitcoin’s next big movement will influence altcoins like Chainlink.

Featured image from Unsplash.
Charts from TradingView.

Is The VIX Volatility Index Forecasting A Major Bitcoin Crash?

Bitcoin price is consolidating just below $20,000. As the last confrontation with $10,000 has shown, consolidation below resistance is typically a…

Bitcoin price is consolidating just below $20,000. As the last confrontation with $10,000 has shown, consolidation below resistance is typically a bullish event. However, with such strong resistance above, the uncertainty surrounding the pandemic, the coming vaccine, and the change of power happening in the United States, there’s a recipe for rejection as well.

And while signals are mixed and analysts are divided, the VIX volatility index could be warning of an extremely volatile drop to come.

The Bearish Case: VIX Volatility In The Past Triggers Crypto’s Biggest Crashes

The cryptocurrency market is confused currently. After chaotic capitulation on Black Thursday, Bitcoin has done the unthinkable and risen from under $4,000 to nearly $20,000 in a year underscored by uncertainty, fear, and a pandemic, unlike the modern world has ever witnessed.

The world first learning of what was to come in March 2020, triggered the Black Thursday panic selloff that cut the leading cryptocurrency by market cap down by over 60% in days.

Related Reading | “Cyclical Nature Of Bitcoin” Could Provide Clues On Continuation Or Correction

The burst of volatility – measured by the VIX – is the largest in the asset’s young history. Bitcoin was born during The Great Recession, and the VIX hasn’t had anywhere near as sharp a spike as then, until 2020.

The VIX rose above a reading of 20 during most Bitcoin crashes historically | Source: BTCUSD on TradingView.com

The Volatility Index on Black Thursday spike to above a reading of 20, and has remained there since. The metric touched down on the key level, before beginning to turn back up – potentially signaling volatility ahead.

And this could be a bad sign with Bitcoin trading below its most powerful resistance yet of $20,000. According to the chart above, most instances of the VIX rising beyond a reading of 20 has led to a sharp selloff in crypto. While the market is at extreme exuberance, could this happen again?

The Bullish Case: Bitcoin Historic Volatility Begins To Grow, Could Resolve to The Upside

Volatility is defined by Investopedia as a representation “of how large an asset’s prices swing around the mean price,” adding that it is a “statistical measure of its dispersion of returns.”

As the definition explains, volatility can move in either direction and doesn’t necessarily mean a drop. Bitcoin is considered one of the most volatile assets in history, yet even though it is testing $20,000, certain tools show volatility is extremely low.

The resolution of low volatility phases often results in periods of heightened volatility. This is measured by several technical indicators and is expressed in how tightly coiled or how wide the Bollinger Bands are. Bollinger Band Width is a separate tool focused on only this.

Several volatility measuring tools show Bitcoin as historic lows | Source: BTCUSD on TradingView.com

According to the tool and historical volatility, Bitcoin’s bull run hasn’t even really started yet in terms of the volatility it will soon bring.

Related Reading | Bitcoin Intraday Volatility Explodes, But Historically Is Only Just Getting Started

Looking at past cycles and related measurements on each tool definitely demonstrates how little volatility is there currently by comparison. The largest increases in volatility in Bitcoin has always led to bull markets on the grandest scales. The VIX and the pandemic are unusual factors that weren’t applicable to past cycles, so anything is possible.

And while the signals are mixed and analysts are indeed divided, there is a chance they are both right – Bitcoin is going to go down and up – many, many times from here on out – until the asset has topped and it all starts over again.

Featured image from Deposit Photos, Charts from TradingView.com

XRP Gains Ground Against Bitcoin as Active Address Count Remains High

XRP has seen some wild price action over the past few days and weeks, with investors sending the previously embattled token…

XRP has seen some wild price action over the past few days and weeks, with investors sending the previously embattled token rocketing by over 300% following its break above the long-held trading range between $0.20 and $0.30.

The selling pressure in the mid-$0.60 region has proven to be quite intense in the past and may continue hampering its price action in the days and weeks ahead as it tries to surmount this.

This breakout isn’t the only thing that helped the crypto rally higher, as the upcoming Spark airdrop was also a catalyst for this push higher.

Because many investors now look favorably upon airdrops due to the success of that conduct by Uniswap, the one being sent to XRP holders in the coming weeks likely helped drum up some serious buying activity.

One analytics firm spoke about this in a recent tweet, explaining that while XRP is gaining some ground against Bitcoin, its price is being driven higher by an influx of daily active wallet addresses interacting with the token and with the network.

This is a sign of fundamental strength that may help boost the cryptocurrency’s price action going forward.

XRP Struggles to Break $0.60

At the time of writing, XRP is trading down just under 3% at its current price of $0.60. This marks a notable surge from where it was trading just a couple of days ago when it dipped to lows of $0.54.

Where it trends in the mid-term may depend largely on Bitcoin and Ethereum, as their general trends have typically played a large role in that of XRP and other major altcoins.

Analytics Firm: Daily Active Address Count Remains High as Airdrop Nears

Despite XRP not gaining enough momentum to break above $0.60, the number of users interacting with the token and the network remains incredibly high.

They noted that the cryptocurrency’s daily active address count is stable following its sharp peak seen a couple of weeks ago.

“XRP is making up more ground on BTC in 2020 with a modest +5% in the past day. An encouraging sign is that Ripple’s daily active addresses have stayed significantly higher than its year average since spiking two weeks ago.”

Image Courtesy of Santiment.

If this metric remains high as the Spark airdrop approaches, there’s a strong possibility that XRP will continue to gain momentum heading into this highly anticipated event.

Featured image from Unsplash.
Pricing data from TradingView.

Top 5 Crypto Price Technical Analysis 7th to 12th December 2020

Crypto price Technical analysis is the study of statistical patterns, obtained from the historical price and volume data, to identify opportunities for trade. Technical analysts analyze trends of price fluctuations, trading signals, and other analytical methods to determine the strength and weakness of an asset.

Technical Analysis may apply historical trading data such as cryptocurrencies, forex, commodities, and stocks to any protection.

you can find below these top 5 crypto price prediction report.

  1. Ethereum (ETC)
  2. Bitcoin (BTC)
  3. Ripple (XRP)
  4. Litecoin (LTC)
  5. Bitcoin Cash (BCH)

With BuyUcoin you will get knowledge of Cryptocurrency Trading

Lets Start…

Bitcoin (BTC) Price Update

Bitcoin Crypto Price Technical analysis graphically

BTC did manage to pull back from our intraday regions of 18500$ and reached the 19500$, we believe upside push to be extended towards the 19600-19700$(wick fishing towards that region), from there a drop towards the 17,000$ is expected.

Trade Bitcoin at 0% Fees! & Win Cashback

Ethereum (ETH) Price Update

Ethereum Crypto Price technical analysis graphically

ETH has completed its intraday upside movement of 590$-600$, aligning with the BTC analysis ETH can see the upside push one last time before coming back towards the downside of 500-520$.

Trade ETH at 0% Fees! & Win Cashback

Ripple (XRP) Price Update

Ripple crypto price technical analysis graphically

XRP did outperform BTC and ETH in the past few days and breached the 64 cents regions(which was unexpected).

We believe the XRP rally is within the final phase and we can expect the drop soon (Wait for the confirmation from BTC and ETH)

XRP downside targets are located towards the 0.5$(first zone) and even push towards the 0.40$(second target).

Trade Ripple at 0% Fees! & Win Cashback

Litecoin (LTC) Price Update

Litecoin crypto price technical analysis graphically

LTC is also holding the current 80$ region (forming the lower highs on the higher time frame).

Aligning with the BTC analysis LTC will start its downside movement towards the 50$ soon.

As most of the alts have completed their upside movements of the longer-term perspective, we think it’s time to start considering the downside targets of BCH as well.

Trade LTC at 0% Fees! & Win Cashback

Bitcoin Cash (BCH) Price Update

Bitcoin Cash crypto price technical analysis graphically

Long term upside targets of BCH is located at around 480-500$, if it comes through that will be ~60% profits from the current zone. (if BTC and ETH sustain its zones, BCH will likely to hit the zone).

As the drop is expected from the BTC, we can see the downside regions of BCH first before going towards the upside zones. (Target located at around 200-240$).

Trade BCH at 0% Fees! & Win Cashback

Source:- BuyUcoin’s Newsletter

Yearn.finance (YFI) Inches to $30k; Flashes Similarities to ETH in 2016

Yearn.finance’s YFI governance token has been inching closer and closer to the $30,000 level for the past few days and weeks,…

Yearn.finance’s YFI governance token has been inching closer and closer to the $30,000 level for the past few days and weeks, with the selling pressure here proving to be somewhat significant on multiple occasions.

Overall, the crypto’s price is currently caught within a holding pattern similar to that seen by Bitcoin and Ethereum,

Until the larger digital assets breakout – or breakdown – and gain clearer momentum there’s a strong possibility that YFI will continue consolidating as well.

Despite it not being able to break above $30,000 just yet, its technical outlook is growing brighter by the day.

One trader is now noting that Yearn.finance’s current technical structure reminds him strikingly of Ethereum’s in late-2016. At this time, the crypto saw a consolidation phase that resulted in a breakout with parabolic momentum.

If history rhymes and YFI sees a similar breakout in the days and weeks ahead, there’s a strong possibility that the cryptocurrency could enter another price discovery phase that results in it seeing some parabolic momentum.

This momentum will likely extend well into 2021, according to the analyst. He reckons that it will see similar price action during this period as ETH did throughout 2017.

Yearn.finance Inches Higher as Investors Closely Watch $30,000

At the time of writing, Yearn.finance’s YFI token is trading down just over 3% at its current price of $28,400. This is around the price at which it trading throughout the past week.

For a brief moment, it climbed as high as $32,000 before it met some serious resistance and plunged lower.

It has been closely tracking the overall trends seen by Bitcoin and Ethereum as of late, making it imperative that these assets rally higher for it also to see further gains in the mid-term.

Trader Claims YFI Could Be Mirroring a Bullish ETH Fractal

One trader stated in a recent tweet that Yearn.finance’s YFI token could be in the process of mirroring a highly bullish Ethereum fractal from 2016, which would indicate that 2021 will be an incredibly positive year for the DeFi benchmark.

“Get the feeling YFI is gonna pull a late 2016 $ETH and build up insane pressure in the form of an ascending triangle and blast off into price discovery during late December-early January whilst the real bull run plays out in 2021 (2017 for ETH).”

Images Courtesy of HornHairs. Source: YFIUSD on TradingView.

Where the entire market trends in the mid-term will depend on Ethereum and Bitcoin. These two digital assets have been guiding the DeFi market, which means that Yearn.finance’s fate is at least partially in their hands.

Featured image from Unsplash.
Charts from TradingView.