Why The Double Top Narrative In Bitcoin Doesn’t Make Sense

Bitcoin price just set a new all-time high today, and then immediately dropped $500 and is trading below the former peak…

Bitcoin price just set a new all-time high today, and then immediately dropped $500 and is trading below the former peak once again. Murmurs of a “double top” scenario have been making rounds across the speculation-driven crypto community.

However, one well-known crypto trader and analyst explains why such a scenario is nearly impossible, due to the requirements involved in confirming the technical chart pattern.

Bitcoin Sets New All-Time High, Drops $800 Immediately After

Bitcoin price set a new all-time high of $19,863 on Binance and beat the former peak on other spot crypto exchanges like Coinbase and Bitstamp, certifying the historic moment.

Within minutes of the achievement, however, the leading cryptocurrency by market cap plunged by $800 and is back holding onto $19,000 as support.

The rejection here after a new peak was set, and even before as Bitcoin has previously stopped short of a new high, sparked discussion and wild speculation over a possible “double top” scenario.

Related Reading | Bitcoin Rally Isn’t Just Institutional Driven, Emerging Markets Are Voting For Revolution

Double tops occur when an asset peaks at or around the same resistance level at the height of two rallies. The resistance that is created, can often be unbreakable and causes a complete reversal – hence being called a “top.”

But like any chart patterns, they must meet certain requirements to “confirm” as “valid,” and according to one well-known crypto trader, the scenario is just nonsense.

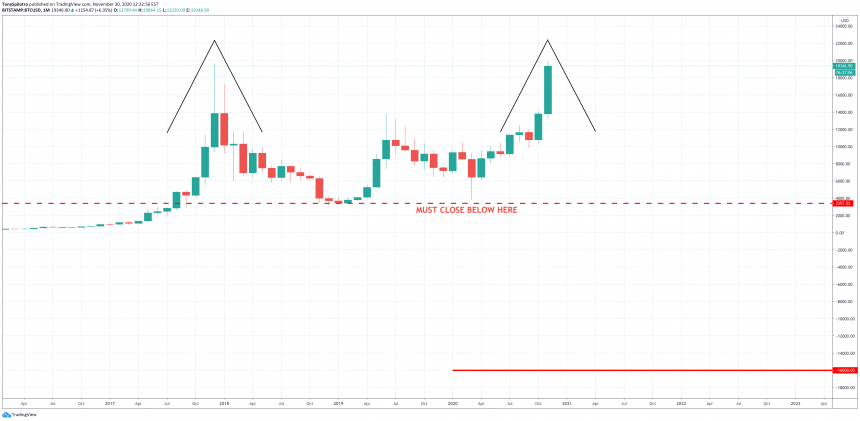
A Bitcoin double top requires bottom support to break down | Source: BTCUSD on TradingView.com

Crypto Trader Breaks Down Why BTC Won’t Double Top

According to DJ, analyst, and trader Scott Melker, who goes by The Wolf Of All Streets moniker on Twitter and elsewhere, a “double top” is extremely unlikely.

Melker explains that the requirements to confirm such a pattern as valid would require a break of the swing low between each of the two tops.

The swing low being Bitcoin’s bottom at $3,200. If Black Thursday couldn’t break it, most likely nothing will, and it becomes even more unlikely with the cryptocurrency so close to breaking out into a bull market.

Additionally, Melker outlines that the target of such a structure would be roughly -$16,000 – as in a negative price per BTC.

Unlike oil that requires a hefty cost to store, Bitcoin prices would not fall into negative territory. Zero is of course possible but is at this point less feasible than $100,000 per coin.

Bitcoin topping here isn’t all that bad, either. The first-ever crypto-asset could be forming a massive ascending triangle formation – a bullish technical continuation pattern.

 An ascending triangle could be forming as Bitcoin is ahead of schedule | Source: BTCUSD on TradingView.com

According to a comparison with the last crypto market cycle, Bitcoin is currently far ahead of schedule in terms of setting a new all-time high. With Bitcoin halving theories based on a four-year block reward reduction mechanism, market cycles are expected to follow a somewhat similar trajectory.

Related Reading | Here’s What Will Happen To Altcoins Once Bitcoin Breaks $20,000

This could imply that either there will another stretch of consolidation around current prices for the next three to six months, or that the macroeconomic environment due to the pandemic and out-of-control money printing, could be having that dramatic of an impact.

If that’s the case, being concerned with a “top” around $20,000 could be as foolish as Melker makes it out to be, as the cryptocurrency’s momentum will take it much higher before the next peak is in.

Featured image from Deposit Photos, Charts from TradingView.com

Why This Trader is Optimistic That Ethereum Will Spark a Massive Altcoin Rally

Altcoins have been closely tracking Bitcoin and Ethereum’s price action as of late, which is a positive sign showing just how…

Altcoins have been closely tracking Bitcoin and Ethereum’s price action as of late, which is a positive sign showing just how far the markets have come over the past few weeks.

While in the past, Bitcoin rallies occurred independently from the rest of the market, with altcoins trailing it or rallying during consolidation phases, the entire market is now moving in tandem.

This trend has greatly favored altcoins, with many posting massive gains throughout the past few days and weeks as BTC navigates towards $20,000.

One trader is now offering a bullish outlook on altcoins, explaining that Ethereum’s ongoing upswing leads him to be optimistic on smaller digital assets’ outlook.

Ethereum is now trying to hold above $600 – if it can flip this level into a strong support level, it could open the gates for the altcoin market to see significantly further upside in the days and weeks ahead.

This will hinge largely on Bitcoin, as the benchmark cryptocurrency is struggling to break above $20,000 despite being able to set fresh all-time highs earlier this morning.

If it continues extending this momentum and does break above $20,000, the entire market will likely see massive inflows of capital that leads altcoins to see parabolic, speculation-induced uptrends.

Ethereum Rallies Higher Alongside Bitcoin

At the time of writing, Ethereum is trading up over 4% at its current price of $601. This marks a notable surge from its recent lows of $490 set at the bottom of the recent selloff.

The selloff seen last week by the entire market appears to have been a bear trap of epic proportion, with the strength seen in the time since ETH and BTC set their lows being quite impressive.

It does seem as though the rebound from these lows sparked the ongoing rally.

Trader Claims ETH Strength Likely to Spark Altcoin Rally

One trader believes that the strength seen by Ethereum as of late could be enough to spark a strong rally for altcoins.

He notes that he has added exposure to Chainlink and some Uniswap tokens to capture some of this potential upside.

“I’m 20% alts now, ETH popping makes me carefully optimistic. Aiming for 25% by mid december, and will ape stupidly, up to 50%, IF BTC goes to ATH and they capitulate simultaneously. 10% ETH, 5% LINK, 5% a basket of scams including uniswap coins.”

Image Courtesy of SalsaTekila. Source: ETHBTC on TradingView.

Whether or not Ethereum can hold above $600 heading into its daily candle close should provide some serious insights into where it will trend in the days and weeks ahead.

Featured image from Unsplash.
Charts from TradingView.

Top 5 Crypto Price Technical Analysis 30th Nov to 5th Dec 2020

5 Crypto price technical analysis, BuyUcoin has started with an initiative to guide fellow crypto enthusiasts towards a better-investing strategy. This, basically, will be video sessions by our technical expert in which you will be provided with the weekly price predictions and technical analysis reports of the top 5 cryptocurrencies, that are-

With BuyUcoin you will get knowledge of Cryptocurrency Trading

Bitcoin (BTC) Crypto Price Technical Analysis

Bitcoin crypto Price technical analysis graph

BTC did manage to pull back from our intraday regions of 16300$ and reached the 18500$, we believe upside push to be extended towards the 18800$(wick fishing towards that region), from there a drop towards the 14,000$ is expected.

Trade Bitcoin at 0% Fees!

Ethereum (ETH) Crypto Price Technical Analysis

Ethereum crypto price technical analysis graph

ETH has completed its intraday upside movement of 590$-600$, aligning with the BTC analysis ETH can see the upside push one last time before coming back towards the downside of 400-420$.

Trade Ethereum at 0% Fees!

Ripple (XRP) Technical Price Analysis

Ripple crypto price technical analysis graph

XRP did outperform BTC and ETH in the past few days and breached the 64 cents regions(which was unexpected).

We believe the XRP rally is within the final phase and we can expect the drop soon (Wait for the confirmation from BTC and ETH)

XRP downside targets are located towards the 0.40$(first zone) and even push towards the 0.30$(second target).

Trade Ripple at 0% Fees!

Litecoin (LTC) Technical Price Analysis

Litecoin crypto price technical analysis graph

LTC is also holding the current 80$ region (forming the lower highs on the higher time frame).

Aligning with the BTC analysis LTC will start its downside movement towards the 45-50$ soon.

Trade Litecoin at 0% Fees!

Bitcoin Cash (BCH) Technical Price Analysis

Bitcoin Cash crypto price technical analysis graph

As most of the alts have completed their upside movements of the longer-term perspective, we think it’s time to start considering the downside targets of BCH as well.

Long term upside targets of BCH is located at around 480-500$, if it comes through that will be ~60% profits from the current zone. (if BTC and ETH sustain its zones, BCH will likely to hit the zone).

As the drop is expected from the BTC, we can see the downside regions of BCH first before going towards the upside zones. (Target located at around 200$)

Originally Source:- Top 5 Crypto Price Technical Analysis

COTI Network Strikes Deal with Gaming Giant Dafabet

One of the world’s largest gaming groups, Dafabet, has revealed that it is working with COTI to facilitate digital currency processing….

One of the world’s largest gaming groups, Dafabet, has revealed that it is working with COTI to facilitate digital currency processing. The deal is a coup for COTI, which is on a mission to become the industry’s go-to network for digital payments, and is indicative of where the gaming industry is heading: the same place as all other online industries are heading – crypto.

The deal between COTI and Dafabet is much more than an LOI or exploratory pilot: COTI has constructed a dedicated wallet and payment system for Dafabet, which will be integrated into several of the gaming platforms under Dafabet’s control. The goal is to deliver a crypto payment experience that, from the customer’s perspective, is as frictionless as paying with fiat.

COTI Levels Up

The deal with Dafabet is COTI’s largest to date, certainly on the basis of Dafabet’s turnover, which stands at around $1 billion per year. With 1.5 million unique visitors a month alighting on the company’s string of gaming sites, it has the potential to drive a lot of eyeballs in the direction of crypto, albeit obliquely; COTI’s value proposition hinges around making payments as seamless as possible. That means no interminable waiting for mempools to clear and bitcoin transactions to be confirmed.

COTI’s Trustchain will be instrumental in routing digital payments, complemented by its Payment Gateway tech stack. The product that will be integrated into Dafabet’s gaming sites is a branded version of COTI’s Ultra eWallet. It includes fiat currency and stablecoin support, enabling users to enjoy the benefits of crypto without the issue of price volatility. The speed of COTI’s Trustchain network, meanwhile, will ensure that transactions settle almost instantly.

COTI has stated that it expects the volume of transactions taking place on Trustchain to increase significantly as a result of the Dafabet deal. This in turn will benefit COTI holders, stakers, and node operators, who will see a lot more traffic flowing through the high-speed crypto network.

Big in Britain, Asia, and Elsewhere

In the UK, Dafabet is a well-known gaming operator, whose logo clings to the shirts of top-flight teams such as Celtic in Scotland and Aston Villa in England. The company also sponsors another half dozen football clubs in the English leagues and several cricket clubs too. On a global basis, Dafabet enjoys strong brand recognition in Asia, whose love of gambling requires no explanation, and the company is headquartered in the Philippines.

Since its inception in 2004, Dafabet has grown into one of the world’s top 20 e-gaming operators, with a presence on every major continent. As for COTI, it is no stranger to the world of gaming either. The blockchain company is headquartered in Gibraltar, where many of the UK’s gaming operators are domiciled. On November 24, COTI announced the release of Blockchain Dollars, a stablecoin product designed for the gaming industry. Its partnership with Dafabet further strengthens that offering, and leaves no doubt as to where COTI’s loyalties lie.


How Ethereum Could Stage Rally To $600 If It Clears $550

Ethereum started a fresh increase from the $480 support zone against the US Dollar. ETH price must surpass $550 to start…

Ethereum started a fresh increase from the $480 support zone against the US Dollar. ETH price must surpass $550 to start a strong upward move towards $600.

  • ETH price declined heavily from $620 and it even tested $480 against the US Dollar.
  • The price is currently recovering above $500 and the 100 simple moving average (4-hours).
  • There is a key bearish trend line forming with resistance near $550 on the 4-hours chart of ETH/USD (data feed via Kraken).
  • The pair could rise sharply towards $580 and $600 if it clears the $550 resistance.

Ethereum Price is Approaching Next Break

This past week, bitcoin and ethereum saw a sharp downside correction below $17,000 and $550 respectively against the US Dollar. ETH price even spiked below the $500 support and the 100 simple moving average (4-hours).

It tested the $480 support level and formed a support base for a fresh increase. Ether recovered above the $500 level and the 100 simple moving average (4-hours). The price even climbed above the 23.6% Fib retracement level of the downside correction from the $620 swing high to $480 swing low.

The price is now approaching a major resistance area near $550. There is also a key bearish trend line forming with resistance near $550 on the 4-hours chart of ETH/USD.

Source: ETHUSD on TradingView.com

The 50% Fib retracement level of the downside correction from the $620 swing high to $480 swing low is also near the $550 level to act as a major resistance. A successful break above the $550 level could spark a strong upward move.

The next key resistance is near the $580 level. If ether clears the $580 resistance, it could even retest or surpass the $600 resistance level in the coming sessions.

Fresh Decline in Ether (ETH)?

If Ethereum fails to extend its rise above $550, it could start another downward move. The first major support zone sits near the $520 level.

The 100 simple moving average (4-hours) is also near the $512 level to act as a major support. A downside break below the $512 level and $500 might put ether at a risk of more losses below $480.

Technical Indicators

4 hours MACD – The MACD for ETH/USD is slowly gaining momentum in the bullish zone.

4 hours RSI – The RSI for ETH/USD is now above the 50 level, but showing a few bearish signs.

Major Support Level – $512

Major Resistance Level – $550