Ethereum Likely Set Its Local Low for the Year as Buyers Defend $500

Ethereum has been flashing signs of immense strength today, with the cryptocurrency surging up towards $550 as bulls try to erase…

Ethereum has been flashing signs of immense strength today, with the cryptocurrency surging up towards $550 as bulls try to erase the recent losses that came about due to the recent market-wide selloff.

This comes as Bitcoin also shows some signs of strength, with the benchmark cryptocurrency navigating towards $18,000 following its recent decline that sent it down to lows of $16,400.

Bitcoin is firmly leading Ethereum and the rest of the market. The potent reaction that both assets have seen after tapping their local lows does seem to be a bull-favoring sign.

One analyst is now noting that Ethereum is likely to see significantly further upside in the near-term, with its strength showing no signs of slowing down as bulls move to regain control of its trend.

He believes that $500 will prove to be a long-term local bottom for the crypto and that it will only see upside from here heading into the end of the year.

It is also possible that it will enter an accumulation phase between these lows and its current price level, which will bolster any uptrend in early-2021.

Ethereum Shows Signs of Strength as Buyers Take Aim at $600 

At the time of writing, Ethereum is trading up just under 5% at its current price of $543. This marks a notable upswing from its recent lows of $490 set at the bottom of the recent selloff.

The ardent defense of $500 by bulls indicates that this is a strong support level that may continue bolstering its price action for the weeks to come.

So long as it consolidates above $500 and confirms this as a strong support level, there’s a strong possibility that it will see further upside.

Analyst: ETH Likely to Rally Higher Throughout Rest of 2020

While speaking about Ethereum’s potential outlook, one trader explained that he expects it to see some serious upside in the weeks leading up to the end of the year.

He further added that he expects $500 to prove to be a long-term local low for the cryptocurrency that helps spark its next sustained uptrend.

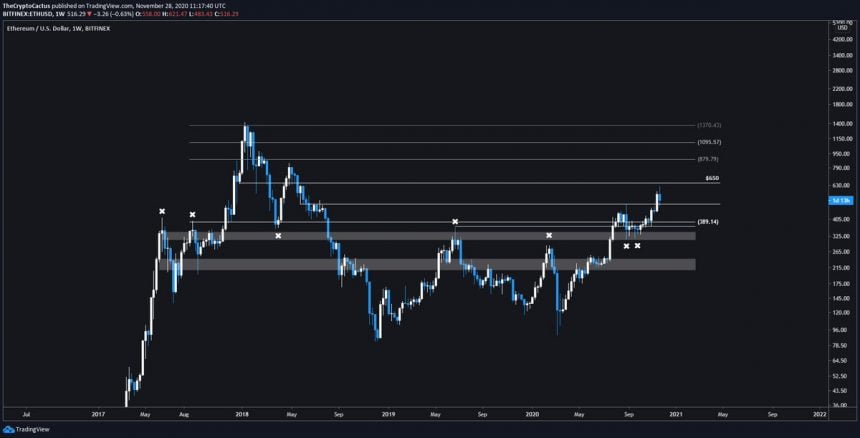
“ETH / USD: Weekly chart looking excellent right now, while $650 resistance was rejected pretty harshly, now strong support is being show at $500 buyers defending aggressively… LTF expecting accumulation at $500 and hopefully this is a local low for the rest of the year.”

Image Courtesy of Cactus. Source: ETHUSD on TradingView.

Ethereum’s near-term price action will likely depend largely on Bitcoin, which does seem to favor bulls at the moment, with the benchmark cryptocurrency now pushing up towards $18,000.

Featured image from Unsplash.
Charts from TradingView.

Here are the Crucial Levels Bitcoin Must Break to See an Explosive Move Higher

Bitcoin has seen a strong move higher throughout the past day, with bulls aiming at reversing the recent market-wide selloff as…

Bitcoin has seen a strong move higher throughout the past day, with bulls aiming at reversing the recent market-wide selloff as the cryptocurrency begins pushing higher.

Where it trends next will likely depend largely on whether or not bulls can maintain the ongoing uptrend as the weekly candle close fast approaches. Where this candle closes will likely set the tone for the week ahead and offer insight into its macro-outlook.

There are still a few crucial levels that need to be surmounted before Bitcoin can see significantly further upside.

It is currently trading between a few key levels, and how it continues reacting to the selling pressure that exists here will provide insight into its mid-term outlook.

One trader is now noting that a break above the resistance that sits right above where it is currently trading at could lay the groundwork for the benchmark cryptocurrency to see an explosive move higher shortly.

A rejection here, however, could stunt its growth and cause it to resume the downtrend that came about after it faced a rejection around its all-time highs in the mid-$19,000 region.

Bitcoin Struggles to Gain Momentum as Selling Pressure Ramps Up 

At the time of writing, Bitcoin is trading up just under 4% at its current price of $17,750. This marks a notable climb from its recent lows of $16,400 set at the bottom of the recent market-wide selloff.

It also marks a notable upswing from where it has been trading throughout the past day, with bulls previously struggling to break above $17,000.

If it can hold above this level and possibly navigate into the $18,000 region, it could be a sign that further upside is imminent for the entire market.

Analyst Claims Current Price Region is Critical for Future Outlook

One trader explained in a recent tweet that Bitcoin’s response to its current price region will offer important insights into its near-term trend.

He points to the price region between $17,650 and $17,800 – which is where it is currently trading – as a “sticky area” that may slow its ascent. So far this has proven to be accurate.

“BTC: Bitcoin retesting $17,160 here and I want to see this level flip the move up. Next sticky area is around $17,650 to $17,800 which was previous support prior to the breakdown. Reclaim there and I think that’s a nice start for the price as it should likely move to mid $18ks.”

Image Courtesy of Josh Rager. Source: BTCUSD on TradingView.

Unless Bitcoin faces a harsh rejection around its current price levels, there’s a strong possibility that further upside is imminent in the near-term.

Featured image from Unsplash.
Charts from TradingView.
Whales Dump Ahead Of Bitcoin ATH, More Than 93K BTC Sold Since Peak

Bitcoin price is now trading at roughly 15% less than it was just days ago, falling short of setting a new…

Bitcoin price is now trading at roughly 15% less than it was just days ago, falling short of setting a new all-time high by just a few hundred dollars.

A new record was so close bulls could taste the victory, but the achievement was blocked by massive whales who reloaded centralized crypto exchanges with a flood of BTC to be dumped, stopping the rally in its tracks. Here’s what this could mean for the crypto market over the next few weeks.

Whales Flood Crypto Exchanges With 93K BTC, Bring Bitcoin Rally To Abrupt End

Bitcoin was moments away from making history, setting a new all-time high in price and breaking the 2017 crypto bubble record. New BTC addresses are at record highs, as is hash rate, and even the cryptocurrency’s market cap. But so far, price couldn’t yet follow.

Related Reading | Time To Pay Attention: Where The Bitcoin Bull Market Correction Might End

A new all-time high in Bitcoin price could create a storm of FOMO, which whales potentially sought to stop just before the record was broken.

According to on-chain analytics, whales began moving BTC en masse to centralized crypto exchanges like Coinbase in the days and hours leading up to the near-recording breaking finish to the recent rally.

Sell walls on Coinbase were reported, and whale watching on various crypto quant platforms were giving signs of their activity just before the selloff began.

Over $15 Billion In Profit Taken Since Peak Was Put In

Whales moved and sold as much as 93 BTC since the peak at $19,500, or roughly $1.5 billion in profit taken even at an average sell price of $17,000 per coin.

Whales got in the way of the crypto asset setting a new all-time high price record | Source: BTCUSD on TradingView.com

Where the rally stopped is notable for narrative-sake. Double-tops are notorious for causing unbreakable resistance, and the current price action is a candidate for such a top formation.

Related Reading | Bitcoin Indicator Reaches Historical Extreme: Price Sheds Two Thirds Upon Reversal

It could be enough to cause a bearish wave of doubt in the cryptocurrency, just as some negative news begins trickling into the market, in terms of self-custody regulation in the US.

The double-top narrative caused by whales taking profit during an extremely profitable year could provide the sentiment necessary for the final shakeout before the cryptocurrency goes full parabolic and races to its next peak.

All that starts with a break of the previous all-time high. Will whales continue to block the new record, or will the crypto asset’s unstoppable bullish momentum leave whales underwater?

Featured image from Deposit Photos, Charts from TradingView.com

OKEx Sees Massive Bitcoin Outflows as BTC Weakness Mounts

Bitcoin’s price has been flashing signs of immense weakness throughout the past few days, with the recent $19,500 rejections sending it…

Bitcoin’s price has been flashing signs of immense weakness throughout the past few days, with the recent $19,500 rejections sending it reeling lower as analysts watch for further downside.

The rejection just below its all-time highs was certainly what sparked the ongoing correction, but some other factors are at play here.

One such factor is recent comments from the U.S. Treasury Secretary regarding a potential wave of regulations on the crypto market before leaving his position in late-January. It remains unclear if the next administration pursues the same aggressive approach to crypto.

Another factor that may actually be the main impetus of this selloff is OKEx, enabling withdraws for users that previously had their Bitcoin locked on the platform for well over a month.

This coincided closely with the recent selloff, which indicates that it may be a factor.

Data from an analytics firm shows that in total, 212,000 BTC has left the platform since withdraws were resumed. Traders who had their crypto locked throughout the course of the recent rally may have taken this as an opportunity to take profits off the table.

Bitcoin Struggles to Gain Momentum as Selling Pressure Ramps Up

At the time of writing, Bitcoin is trading up just over 2% at its current price of $16,780. This marks a massive decline from its recent highs of $19,500 set at the peak of the recent uptrend.

The decline that has forced BTC into the $16,000 region came about directly after the rejection at its all-time highs, signaling that the selling pressure here is significant and may continue hampering its price action in the days and weeks ahead.

Where it trends in the mid-term may depend largely, or entirely, on whether or not bulls can reclaim $17,000 – which was previously a key support level.

Data Suggests OKEx Withdraws May Be Driving Ongoing Selloff

One of the main factors behind the $3,000 selloff Bitcoin has seen since reaching its all-time highs is OKEx enabling withdraws.

As one on-chain analytics platform explained:

“Since yesterday’s announcement from OKEx to resume withdrawals, we have seen an outflow of 29,300 BTC from the exchange. In the same time period 21,600 BTC have been deposited, reducing the exchange’s balance to ~212k BTC.”

Image Courtesy of Glassnode.

The coming few days should provide insight into where Bitcoin is trending in the mid-term. Because most of the previously locked BTC on OKEx has been withdrawn already, there’s a strong possibility that this selloff will begin cooling down.

Featured image from Unsplash.
Charts from TradingView.

Bitcoin Indicator Reaches Historical Extreme: Price Sheds Two Thirds Upon Reversal

Bitcoin price this week reached a high of $19,500, following a six-week, 60% rally. From the moment the first-ever cryptocurrency made…

Bitcoin price this week reached a high of $19,500, following a six-week, 60% rally. From the moment the first-ever cryptocurrency made it above $12,000, on 3-day timeframes, there were twelve consecutive green candle closes without any red.

The extreme bullish impulse caused one specific technical indicator to reach the highest reading in history – reached only three times prior, all before 2014. Each time, an average correction shaving two-thirds off Bitcoin’s price took place after momentum finally turned downward. Will a historic selloff follow this previously unstoppable rally?

Bitcoin Price Corrects Hard Following Failed Retest Of All-Time High, But More To Come

The price per BTC nearly doubled since the start of September, setting off an explosive FOMO-driven rally that has only just come to an end.

The cryptocurrency went parabolic after breaking back above $12,000 and news that PayPal would be supporting cryptocurrencies. But failure to break its all-time high sent Bitcoin falling back down hard to refuel.

Related Reading | Bitcoin Rally Isn’t Just Institutional Driven, Emerging Markets Are Voting For Revolution

The run up caused the Fisher Transform technical indicator to reach one of four of the highest readings in the cryptocurrency’s just over decade long history.

Interestingly, the extreme deviation of 7.5 or more hasn’t taken place since prior to 2014, back when few even knew what a cryptocurrency was or had heard of Bitcoin. But looking back at these past examples could indicate that a very dangerous situation is brewing.

The Fisher Transform has reached the highest reading in its history for the fourth time ever. | Source: BTCUSD on TradingView.com

Fisher Transform: An Overcorrection Could Be Due For The First Ever Cryptocurrency

During the very first Bitcoin bull market ever, the Fisher Transform indicator reached such an extreme reading three times. The first time the asset ran hot, resulted in a 48% pullback.

The second caused a full 80% retracement, and the third ever started the first Bitcoin bear market between 2014 and 2015 after an initial 64% drop. Now, the signal is back, and by taking the average of the three corrections and extreme readings, an estimated two-thirds could come off the price per BTC.

Past corrections suggest that cryptocurrency is about to correct hard. | Source: BTCUSD on TradingView.com

Bitcoin bull market corrections during the last cycle only reached between 37% and 38% on average. During the first bull market, the average was closer to 64%.

The two bull market correction ranges could provide potential targets for where any downside might reverse. The first of the two targets reside right where the bullish breakout took place at $12,000.

The second, with a 64% retrace would take Bitcoin price back to $7,000 per BTC. As extreme as it sounds, the cryptocurrency is known to overextend in both directions. After the gains of 2020, a sharp move could play out.

A full 64% correction is possible, or will it be the 37% average from last bull market? | Source: BTCUSD on TradingView.com

The midway point of the two targets is also a likely scenario, residing at around $9,200 and would fill one of the remaining CME gaps left behind on the Bitcoin futures chart.

Related Reading | Search Engine Marketing Data Reveals Highest Retail Interest In Bitcoin Ever

Whatever the eventual target, buying the dip successfully could be the most profitable play in Bitcoin history.

Featured image from Deposit Photos, Charts from TradingView.com

XRP Sees Massive Retrace, But Analysts Remain Optimistic

XRP has been on a roller-coaster of a ride throughout the past few days and weeks, with the crypto randomly breaking…

XRP has been on a roller-coaster of a ride throughout the past few days and weeks, with the crypto randomly breaking out of a multi-year trading channel earlier this week that allowed its price to ascend as high as $0.90 on some exchanges.

The selling pressure here was significant, with many long-term holders using the pump as an exit opportunity.

It has struggled to gain any momentum since, which could be a sign that downside is imminent in the days and weeks ahead.

The downturn seen across the aggregated market may also be hampering its growth, as BTC and ETH have both plunged and caused most altcoins to post some serious losses.

One trader is now noting that there are some signs that XRP could be forming a long-term bottom. He points to it closing above a key high time frame level while potentially locking in a bullish divergence in the near-term.

For these potentially bullish factors to result in the cryptocurrency seeing any significant upside, bulls must hold it above one crucial level in the days ahead.

XRP Struggles to Gain Momentum as Market Turns Lower 

At the time of writing, XRP is trading down nearly 30% at its current price of $0.46. This marks a massive retrace from its recent highs of nearly $0.90 set earlier this week at the height of its parabolic uptrend.

Where the entire market trends in the mid-term may depend largely on Bitcoin trends next, as the selling pressure it has been facing led it to dip as low as $16,200 earlier today before it saw a sharp rebound.

XRP does appear to be finding some support around its current price levels. A continued bout of trading here could allow it to rally higher.

Here’s Why the Crypto is Showing Signs of Strength

One trader explained in a recent tweet that XRP is showing some signs of technical strength.

He notes that the intense buying pressure that has been seen around its current price levels could confirm this as a high time frame support region.

“XRP: Wishful thinking that it closes this hourly green, locks in the div, and stays above key HTF level?”

Image Courtesy of Smokey. Source: XRPUSD on TradingView.

XRP will likely trade similarly to other top altcoins in the days and weeks ahead, making strength seen across BTC and ETH pivotal for the crypto to move higher.

Featured image from Unsplash.
Charts from TradingView.