Chainlink Likely to See an Impulse Higher as Bulls Break Key Range

Chainlink has seen a strong push higher over the past few days, with its ongoing rise coming about in tandem with…

  • Chainlink has seen a strong push higher over the past few days, with its ongoing rise coming about in tandem with that seen by Bitcoin and Ethereum
  • This market-wide uptrend has proven to be highly beneficial for altcoins, with many posting massive gains throughout the past few hours as bulls aim at sparking a full-blown 2017-style uptrend
  • Because Bitcoin is showing signs of strength, with each dip being aggressively bought, there’s a strong possibility that further upside is imminent
  • This could bolster Chainlink, which has been reacting quite positively to the recent momentum seen across the market
  • One trader is also noting that the crypto could be on the cusp of seeing significantly further gains due to its recent break above a key trading range

Bitcoin has created some serious tailwinds for the aggregated crypto market, with many altcoins posting massive gains as bulls take full control over the market. This has greatly benefited the “blue-chip” altcoins like Chainlink.

LINK has seen some massive momentum, with bulls pushing it above a crucial resistance level that has long been slowing its growth.

Where it trends in the mid-term will depend largely on Ethereum and the rest of the market, as any serious downturn will likely prove to be particularly impactful for altcoins that have been rallying as of late.

One trader is noting that a channel breakout indicates that further upside is imminent in the near-term.

Chainlink Shows Signs of Strength as Bulls Target $15.00

At the time of writing, Chainlink is trading down just over 3% at its current price of $14.96. This marks a slight decline from its recent highs of nearly $16.00 that were set just a day ago.

Overnight, the entire market faced an intense selloff that sent it down to $13.80.

The buying pressure here was significant and allowed Chainlink to post a “V-shaped” recovery.

Analysts Eye Serious LINK Upside as It Posts Channel Breakout

One analyst is now noting that Chainlink could be poised to see further upside in the near-term due to its recent break above a key trading channel.

“LINK now retesting broken upper channel, face melting wave 3 to the upside likely underway here”

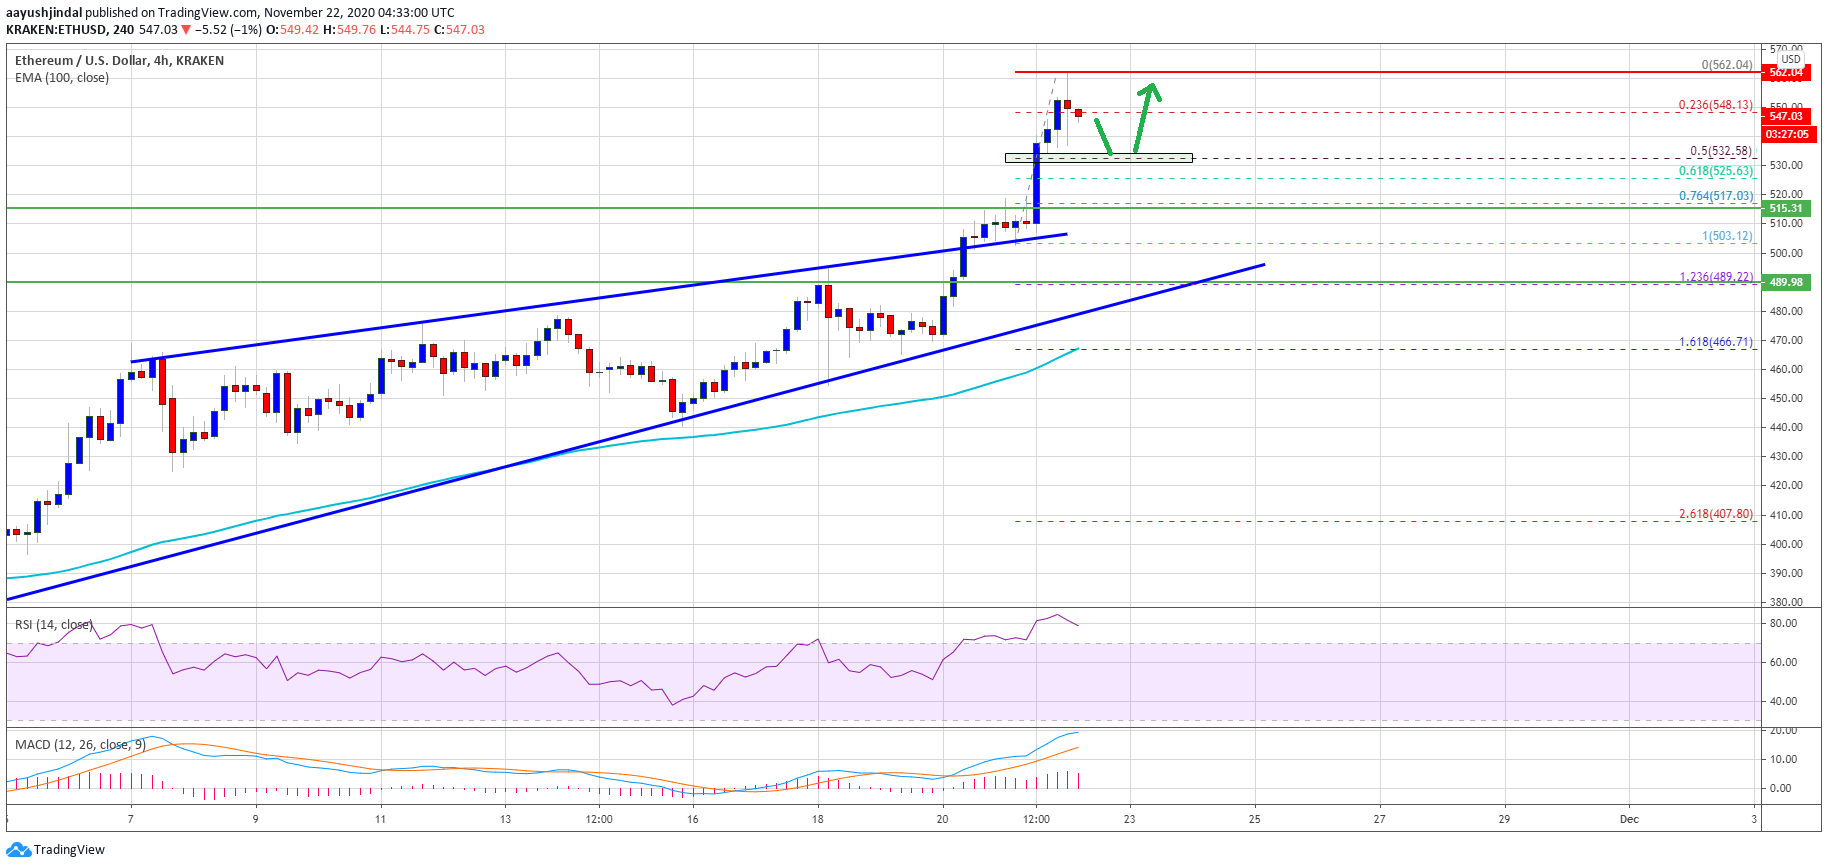
Image Courtesy of @SmartContracter. Source: LINKUSD on TradingView.

If it reaches his target during its next wave higher, it could rally towards $18.00 in the coming days and weeks.

Featured image from Unsplash.
Charts from TradingView.

Ethereum Could Correct Gains, Why Dips Remain Attractive Near $530

Ethereum started a strong surge above the $500 resistance against the US Dollar. ETH price traded as high as $562 and…

Ethereum started a strong surge above the $500 resistance against the US Dollar. ETH price traded as high as $562 and it is currently correcting gains.

  • ETH price traded to a new multi-month high near $562 against the US Dollar.
  • The price is currently correcting lower below $550, but it is well above the 100 simple moving average (4-hours).
  • There is a major bullish trend line forming with support near $495 on the 4-hours chart of ETH/USD (data feed via Kraken).
  • The pair could correct lower, but dips are likely to remain attractive near $530 or $510.

Ethereum Price is Showing Positive Signs

This past week, bitcoin and ethereum gained bullish momentum above $18,000 and $500 respectively against the US Dollar. ETH price surged further above the $520 resistance and settled well above the 100 simple moving average (4-hours).

The upward move was such that there was a break above a key connecting resistance trend line at $508 on the 4-hours chart of ETH/USD. The pair gained pace and traded above the $540 and $550 levels.

Ether price traded to a new multi-month high near $562 and recently started a short-term correction. It traded below the $550 level, and broke the 23.6% Fib retracement level of the recent upward move from the $503 swing low to $562 high.

Source: ETHUSD on TradingView.com

The first key support on the downside is near the $532 and $530 levels. It is close to the 50% Fib retracement level of the recent upward move from the $503 swing low to $562 high.

On the upside, the $555-$560 zone is a key hurdle for the bulls. A successful break above the $560 resistance might start another rally. In the stated case, ether price is likely to rally towards the $580 and $585 levels.

Downside Correction in Ether (ETH)?

If Ethereum fails to extend its rise above $560, it could correct lower. The first major support zone sits near the $532 and $530 levels.

If there are more losses, ether price could move down towards the $510 support zone. There is also a major bullish trend line forming with support near $495 on the same chart, where the bulls are likely to take a strong stand.

Technical Indicators

4 hours MACD – The MACD for ETH/USD is slowly losing momentum in the bullish zone.

4 hours RSI – The RSI for ETH/USD is correcting lower from the 80 level.

Major Support Level – $530

Major Resistance Level – $560

Prominent DeFi Coin Pickle Finance Plunges 50% in Wake of Attack

Holders of Pickle Finance’s native coin PICKLE are currently suffering from a 50% drawdown after the protocol was attacked by an…

Holders of Pickle Finance’s native coin PICKLE are currently suffering from a 50% drawdown after the protocol was attacked by an unknown user. Details are still unclear about the attack but the loss of funds has resulted in users pulling their liquidity and selling the cryptocurrency en-masse.

PICKLE is down to $11.50 as of this article’s writing, just under 50% below where it was 24 hours ago. This makes it one of the worst-performing cryptocurrencies of the past 24 hours. Only bad performers include yAxis and Yield Wars, which both are tangentially related to Pickle.

Related Reading: Here’s Why Ethereum’s DeFi Market May Be Near A Bottom

What Happened With Pickle?

Approximately three hours ago, analysts noticed a suspicious transaction involving Pickle Finance’s pDAI Jar, which invests users’ DAI to earn regular returns paid out in DAI.

The transaction involved a complex Ethereum contract, coupled with $20m worth of DAI that got sent to an address that was not a contract.

It appears to be a bug related to Pickle’s Swap Jar functionality, which allows yield farming strategies to be swapped. The issue was that there apparently was no check to ensure that the Jar the funds were being swapped into was not malicious.

This resulted in the removal of $20m from the contract. It is currently unclear what the attacker will do the funds, though there are some that have attempted to contact the attacker to try and get their money back.

Related Reading: Tyler Winklevoss: A “Tsunami” of Capital Is Coming For Bitcoin

Many DeFi Exploits

This is the latest in many recent DeFi exploits.

Previous attacks included those on Harvest Finance, Value DeFi, Akropolis’ Delphi yield farming pool, and a number of others.

Many believe it is still too early to suggest that this space is ready for mainstream adoption with the number of attacks that have taken place recently.

Related Reading: 3 Bitcoin On-Chain Trends Show a Macro Bull Market Is Brewing
Featured Image from Shutterstock
Price tags: pickle, pickleusd, pickleeth
Charts from TradingView.com
Prominent DeFi Coin Pickle Finance Plunges 50% in Wake of Attack

Here’s Where a “Bitcoin Bear Whale” Has Put Up a Massive Sell Wall

Bitcoin’s price action as of late has greatly favored buyers, with the cryptocurrency being caught within the throes of an intense…

Bitcoin’s price action as of late has greatly favored buyers, with the cryptocurrency being caught within the throes of an intense bout of sideways trading just below $19,000 as buyers try to garner enough buy-side pressure to break through this level.

The selling pressure here has been intense, but it has yet to catalyze any type of intense selloff throughout the past few days.

This seems to point to immense underlying strength amongst buyers and may indicate that near-term upside is imminent. If bulls can break above this level, they may face some resistance around $19,300 before they can push the crypto to new all-time highs.

One trader is noting that there is a Bitcoinbear whale” that has sell orders placed at this level, which may prove difficult to surmount upon the first attempt.

That being said, one analyst explained in a recent tweet that he is expecting Bitcoin to break above this resistance and set fresh all-time highs in the near-term.

Bitcoin Shows Signs of Strength as Bulls Target $19,000

At the time of writing, Bitcoin is trading up marginally at its current price of $18,750. This is around where it has been trading throughout the past few days.

A strong break above $19,000 could catapult BTC to fresh all-time highs, as the resistance in the lower-$19,000 region level is the last resistance seen before $20,000. Once it sets new all-time highs, the media cycle and retail “FOMO” could send it rocketing even higher.

Because of the current strength being projected by Bitcoin, it does seem like a clean break above this level is imminent.

Once new all-time highs are set, it may enter a price discovery mode that results in it seeing significantly further upside.

This “Bear Whale” May Slow BTC’s Ascent

While sharing his thoughts on where Bitcoin might trend in the near-term, one analyst explained that he is watching for a move to all-time highs.

He also notes that there is a “bear whale” that is putting up some serious sell walls at $19,300.

“Longed BTC: Chad Bear Whale is resting at $19.3k and needs relieved of his corns. But more importantly, we have an all time high to make.”

Image Courtesy of LedgerStatus. Source: BTCUSD on TradingView.

Although it may take some time for bulls to chew through these sell orders, it’s clear skies ahead for the crypto once this resistance is broken.

Featured image from Unsplash.
Charts from TradingView.

Ethereum Shatters Critical Resistance as Top Holders Start Accumulating

Ethereum has seen some incredibly strong price action throughout the past few days and weeks, with buyers taking full control of…

Ethereum has seen some incredibly strong price action throughout the past few days and weeks, with buyers taking full control of its price action as they hold it above $500 for an extended period of time.

The selling pressure seen here has proven to be quite significant, as its rally has halted in its tracks as sellers move to force it below this key level.

That being said, where it trends in the mid-term may depend largely on whether or not it can post a weekly candle close above this level this Sunday evening.

Where it trends next will depend almost entirely on its continued reaction to the new price region it is venturing into, as a sustained bout of trading here could open the gates for it to see significantly further upwards momentum in the near-term.

One bullish sign for the crypto’s near-term outlook is that large wallets have been rapidly accumulating the cryptocurrency throughout the past few weeks.

While speaking about this trend, one analytics firm explained that ETH’s top-10 wallets have been rapidly increasing their positions in the cryptocurrency.

Ethereum Rallies Past $500 as Sellers Disappear

At the time of writing, Ethereum is trading up nearly 8% at its current price of $507, which marks a massive rise from its recent lows of $470 set around this time yesterday.

The recent upswing intensity also comes as BTC inches closer and closer to the key $19,000 level.

The strength seen by BTC has spanned across the entire market, with ETH and smaller altcoins alike all pushing higher in tandem.

This trend may persist, as bulls show no signs of loosening up their control over the market.

Top ETH Holders Start Increasing Their ETH Exposure

One trend that undeniably favors bulls is that the top-10 Ethereum holders have all been rapidly moving to increase their cryptocurrency exposure.

This also comes as exchanges see a higher coin supply, pointing to a trend of retail buying.

“Following in BTC’s footsteps, ETH has hit a 29-month high of $509. June 21, 2018 was the last time the price was this high for the #2 market cap asset. Ethereum’s top 10 holders rising, combined with coin supply on exchanges, have fueled this rally.”

Image Courtesy of Santiment.

The coming weekend trading session should provide some serious insights into Ethereum’s mid-term outlook.

Featured image from Unsplash.
ETHUSD pricing data from TradingView.

Search Engine Marketing Data Reveals Highest Retail Interest In Bitcoin Ever

Bitcoin is nearly at $20,000 once again and to the surprise of the crypto community, Google Trends search data now still…

Bitcoin is nearly at $20,000 once again and to the surprise of the crypto community, Google Trends search data now still doesn’t anywhere nearly compare to the search interest back then. However, digging deeper into search engine volume using a plethora of search engine marketing tools, there’s a very different “story” to be told.

Here are the reasons why search volume and related terms suggest that there is far more interest now in Bitcoin than there was at the height of the crypto bubble.

Bitcoin Blows Up But Fails To Boost Google Trends Search Interest

The latest price action is giving crypto investors a flashback of what it was like the last time Bitcoin was trading at these prices.

It was also around Thanksgiving 2017, and the first-ever cryptocurrency had just surpassed $10,000 for the first time, piquing the curiosity of average Joes who were left wondering what the heck a Bitcoin even was.

Related Reading | Bitcoin Approaches Top Of Accumulation Zone, Parabolic Phase Begins With Breakout

To find out, before clicking that buy button on their Coinbase app, they turned on Google to take in all the info they could find.

Bitcoin took off on Google Trends as sharply as its parabolic price pattern, and just as fast, crashed back down to previous lows. And as the Google Trends chart below shows, superimposed over the current BTCUSD price chart, interest just still hasn’t returned. Or has it?


Google Trends data layer behind a Bitcoin price chart | Source: BTCUSD on TradingView.com

SEMRush SEO Tools Tell A Different Story, According To eToro Exec

Marketing is a broad term used to define various strategies for driving sales, visibility, traffic, or conversions of any kind. Without marketing, it is challenging to let the world know something exists.

That’s part of what makes Bitcoin so magical. It has corporate backing, and no marketing department to help spread the word – yet its users are more than happy to handle that for the cryptocurrency.

The tools such marketing departments use to drive traffic and conversions on the web include cost-per-click search engine marketing or focus on search engine optimization. SEO is essentially the practice of trying to get picked up on Google organically, while SEM is when marketing departments pay for the reach instead.

Related Reading | Bulls In Control: Total Bitcoin Market Cap Achieves New All-Time High

These marketers use these tools to specifically target certain subsets of users or behaviors – “cryptocurrency users”, for example.

According to eToro marketing exec Brad Michelson explains that SEMRush – one of the analytical services markets rely on for search engine dominance – paints a lot more bullish of a picture about Bitcoin than Google does.

He claims the total monthly global volume of related Bitcoin search terms, is more than three times as much as the December 2017 figure. The volume is spread across a variety of terms, which could suggest that there’s no need to search just Bitcoin now, and people are instead digging deeper into it.

Terms more common now include the root Bitcoin keyword plus other terms like “mining,” “price,” and “news.” There are also nearly three times as many website pages indexed by search engines.

For whatever reason, Google Trends isn’t picking this up. But there’s also no denying that something is going on with Bitcoin that’s causing the sudden increase in price.

And if it isn’t the retail investors that drove up prices that last time around, then they’ll soon be here after Bitcoin sets a new all-time high – which at this point could be any day now.

Featured image from Deposit Photos, Chart from TradingView.com