Trader Offers Bearish Bitcoin Scenario, Leaving No CME Gaps Left Unfilled

Bitcoin is incredibly bullish, now trading only $2,000 away from setting a new all-time high. The momentum has caused the crypto…

Bitcoin is incredibly bullish, now trading only $2,000 away from setting a new all-time high. The momentum has caused the crypto community to erupt in chatter regarding prices of $100,000 or more in just a year’s time.

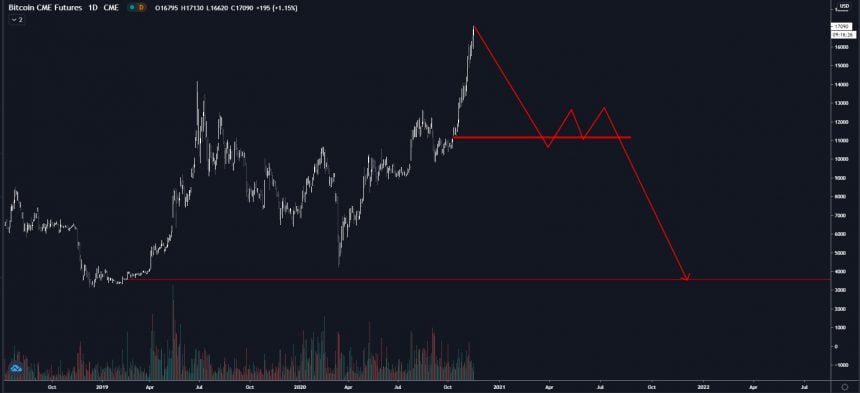
But before this happens, one ultra-bearish trader believes there’s a chance the cryptocurrency could retest its bear market bottom, and potentially fill all remaining gaps left on CME BTC Futures price charts. Is this trader in disbelief, or is there validity to their theory?

Bearish On Bitcoin: One Crypto Traders Expects A Full Retrace

With Bitcoin only a couple thousand dollars away from revisiting its former all-time high, the crypto market is exuberant once again. But this time, they have a reason to be.

The cryptocurrency could be on the cusp of a new bull market so investors are rightfully moving BTC off exchanges and into cold storage for safekeeping. The total BTC on exchanges is at the lowest point since the last bull run.

Related Reading | Bitcoin Captures $17,000, Bears And Bulls Alike In Disbelief

It is hard to imagine anything at this point standing in the way of a repeat of 2017, if not something far more spectacular. Projections from even experts and some of the world’s best investors all expect prices of $100,000 or more someday.

And while most investors and analysts believe that Bitcoin is well on its way and that the “train has left the station,” one bearish trader expects all remaining CME Futures gaps to be filled, before the cryptocurrency moves on to a new all-time high.

Two CME Bitcoin Futures gaps exist that may or may not ever be filled  | Souce: CME BTC1 on TradingView.com

Why Are CME BTC Futures Gaps So Important?

Bearish crypto analyst Joshnomics has shared a chart on Twitter, reminding the crypto community about the two CME Futures gaps left below current levels.

The nearest of the two gaps leftover from the bear market resides at roughly $11,250. The second one is much lower, right around where Bitcoin bottomed in 2018, and lower than the Black Thursday collapse earlier this year.

The latter was caused by the world learning of the pandemic and falling into a panic. The former was due to natural market dynamics. What could cause such a dramatic dive this time around? And why are CME Futures gaps such a big deal?

Related Reading | Bitcoin CME Futures Gaps Are Filled With 95% Certainty, But Trading Them Is Risky

In speculative assets, when official trading desks like the Chicago Merchantile Exchange close up on Fridays, the chart stops tracking price action, while the rest of the world keeps on trading Bitcoin.

When Monday through Friday trading sessions resume, any extreme weekend movements leave a gap behind that more often than not, gets filled. Data shows that the gaps usually get filled within the first week after they appear.

In rare cases, like the gap left behind around Bitcoin’s bottom, it has taken almost two years and the gap still is there, acting as nothing more than a frightening possibility that unbiased traders like the one mentioned cannot rule out.

Featured image from Deposit Photos, Charts from TradingView.com

Bears Control Chainlink as Long as It Holds Below One Crucial Level: Analyst

Chainlink has been holding strong throughout the past few days and weeks around $13.00, with the selling pressure here stopping the…

Chainlink has been holding strong throughout the past few days and weeks around $13.00, with the selling pressure here stopping the cryptocurrency from seeing any intense momentum throughout the past few days and weeks.

LINK has been closely tracking Ethereum’s price action as of late, which caused it to see a sharp selloff yesterday that has since been erased by bulls.

The crypto is still stuck below its near-term resistance at $13.00, and until it can break above this level it may continue facing some consolidation in the days and weeks ahead.

A break above this level would be significant and help spur further upside, but it may not be enough to shift its trend back into bulls’ favor.

One trader is now noting that $13.75 is the crucial level he is watching. Until it can break above this level, the cryptocurrency could see significantly further sideways trading in the days and weeks ahead.

Whether or not it can break above this level will likely depend largely on Ethereum and the aggregated altcoin market.

Chainlink Remains Stuck Below Key Level as Sellers Stay in Control

At the time of writing, Chainlink is trading up 5% at its current price of $12.75. This marks a notable surge from daily lows of $11.80 set in tandem with Ethereum’s decline to $440.

These lows were short-lived, and buyers aggressively reversed this downtrend and sent its price back up to where it has been trading throughout the past few days and weeks.

$13.00 remains a strong resistance level for LINK, as every break above this level in recent times has been met with inflows of selling pressure.

If this level is flipped into support, it could help catapult the crypto significantly higher.

Analyst: LINK Not Bullish Until It Breaks $13.75

While sharing his thoughts on where Chainlink might trend in the near-term, one analyst explained that he is closely watching $13.75.

A break above this level could put LINK into bull territory, with bears having the edge so long as it trades below here.

“Still acting inside resistance here. Flipping $13.75 and I’ll turn bullish. Until then, I’m not,” he said while pointing to the below chart.

Image Courtesy of Crypto Michaël. Source: LINKUSD on TradingView.

The coming few days should provide some insight into where altcoins like Chainlink will trend in the days and weeks ahead.

Ethereum must show continued strength for LINK to break its crucial near-term resistance levels.

Featured image from Unsplash.
Charts from TradingView.

Yearn.finance (YFI) Could Soon “Moon” as It Forms Highly Bullish Pattern

Yearn.finance’s YFI governance token has seen some immense volatility throughout the past few days and weeks, with buyers sending it rocketing…

Yearn.finance’s YFI governance token has seen some immense volatility throughout the past few days and weeks, with buyers sending it rocketing over 100% from its recent lows while now attempting to hold it above a crucial resistance level.

The selling pressure at this resistance had held strong throughout the past several days and weeks, with buyers ardently attempting to spark multiple downside movements when it reached this level.

However, bulls are flashing signs of immense strength today and are now moving to flip this level into support. Holding above it could allow the aggregated DeFi sector to push higher, as YFI has become a benchmark indicator for this fragment of the market.

One trader is also noting that a historically bullish pattern is bolstering YFI’s current technical outlook.

He believes that this could mean that the crypto is poised to see some significant upside in the near-term, potentially leading it up towards the lower-$20,000 region.

Once the resistance that exists here is broken, the crypto could see a parabolic rise that allows it to set new highs.

Yearn.finance Shows Signs of Strength as Bulls Break Key Resistance

At the time of writing, Yearn.finance’s YFI token is trading up nearly 6% at its current price of $18,600.

Where the entire market trends in the near-term will depend largely on whether or not it can post a high time frame close above its key $18,000 resistance, which may soon become support.

The break above this level favors bulls and indicates that significantly further upside could be in store for the cryptocurrency.

YFI’s ongoing uptrend also comes as the rest of the market begins pushing higher, with Bitcoin nearing $17,000 while most altcoins closely mirror its gains.

Trader Claims YFI Could Soon Push Past $20,000

While sharing his thoughts on where Yearn.finance’s YFI might trend in the near-term, one analyst explained that he is watching the lower-$20,000 region’s resistance levels.

He notes that a break above these levels could send it flying up towards its previous highs.

“Sumthin like this for $YFI on the mid term. We break that target area and we go to moon once again.”

Image Courtesy of NekoZ. Source: YFIUSD on TradingView.

Where the Yearn.finance token closes its daily candle in the coming few hours should provide some insight into where it will trend throughout the week ahead.

Featured image from Unsplash.
Charts from TradingView.

Yearn.finance’s YFI Could Soon Rally Past $20,000 as Technical Strength Grows

Yearn.finance’s YFI governance token has been struggling to gain any momentum throughout the past few days and weeks, with buyers aiming…

Yearn.finance’s YFI governance token has been struggling to gain any momentum throughout the past few days and weeks, with buyers aiming at sending the cryptocurrency significantly higher.

YFI’s token has been flashing immense signs of strength throughout the past few weeks, with buyers taking control of its price action after massive inflows of selling pressure sent it down to $7,500 just a couple of weeks ago.

It is now trading up over 100% from these lows but is struggling to break above the heavy selling pressure that exists within the lower-$18,000 region.

Until it can shatter the selling pressure that exists here and rally up to fresh highs, there’s a strong possibility that it will continue consolidating or possibly face some selling pressure.

One trader is pointing to a recently formed technical pattern, noting that he believes that the crypto is poised to rally significantly higher in the days and weeks ahead.

He specifically is looking towards it seeing a move past $20,000, noting that this could open the gates for serious upside in the days, weeks, and months ahead.

Yearn.finance’s YFI Remains Stable Below Key Resistance Despite Market Turbulence

At the time of writing, Yearn.finance’s YFI token is trading down marginally at its current price of $17,100. This is around where it has been trading throughout the past few days.

The resistance at $18,000 is intense and has catalyzed multiple selloffs over the past few days and weeks.

If bears continue holding this level as resistance and cannot post any high time frame close above it, it may see either a prolonged consolidation phase or begin erasing its recent gains.

Analyst: YFI Could Soon Post a Breakout Towards $20,000 

One trader explained in a recent tweet that he is watching for an imminent break above $20,000.

He notes that Yearn.finance has formed what appears to be a bullish triangle formation, with these patterns often resulting in upwards breakouts during bull markets.

“YFI – I’m long. Triangle break. Works until it doesn’t. Hasn’t failed me in the last few trades. Long the triangle break szn,” he said while pointing to the chart seen in the below chart.

Image Courtesy of UB. Source: YFIUSD on TradingView.

Where DeFi altcoins like Yearn.finance trend in the near-term may depend largely on whether or not Ethereum, Bitcoin, and the rest of the market can remain somewhat stable.

Featured image from Unsplash.
Charts from TradingView.

Ethereum Dips Towards $440 Remain Attractive To The Bulls

Ethereum traded above the $450 resistance, but it is struggle near $480 against the US Dollar. ETH price is correcting gains,…

Ethereum traded above the $450 resistance, but it is struggle near $480 against the US Dollar. ETH price is correcting gains, but it is likely to find strong bids near $440.

  • ETH price traded to a new multi-month high near $478 against the US Dollar.
  • The price is currently correcting lower below $465, but it is well above the 100 simple moving average (4-hours).
  • There was a break below a key bullish trend line with support near $460 on the 4-hours chart of ETH/USD (data feed via Kraken).
  • The pair is continue lower, but there is a major support waiting near the $440 and $435 levels.

Ethereum Price is Correcting Gains

This past week, bitcoin and ethereum performed really well above $16,000 and $450 respectively against the US Dollar. ETH price even broke the $465 resistance and settled well above the 100 simple moving average (4-hours).

It traded to a new multi-month high near $478 and recently started a downside correction. There was a break below the 23.6% Fib retracement level of the upward wave from the $425 swing low to $478 high. Moreover, there was a break below a key bullish trend line with support near $460 on the 4-hours chart of ETH/USD.

Source: ETHUSD on TradingView.com

Ether price is now holding the key $455 support zone. The 50% Fib retracement level of the upward wave from the $425 swing low to $478 high is also near the $461 level.

If there is a downside break below the $451 and $450 support levels, the price could correct further lower. The next major support is near the $440 level since it is close to the 100 simple moving average (4-hours). Any further losses could lead the price towards the $425 swing low.

Fresh Increase in Ether (ETH)?

If Ethereum stays above the $450 support or the 100 SMA, there are high chances of a fresh increase. An initial resistance on the upside is near the $465 level.

The first major resistance sits at $470, above which the price is likely to aim a break above the $478 high. In the stated case, the price is likely to accelerate higher towards the $495 and $500 resistance levels in the near term.

Technical Indicators

4 hours MACD – The MACD for ETH/USD is slowly losing momentum in the bullish zone.

4 hours RSI – The RSI for ETH/USD is now below the 50 level.

Major Support Level – $450

Major Resistance Level – $465

Crypto Analyst Expects Ethereum and DeFi to Go on a “Stupid Run”

The decentralized finance sector has posted massive gains throughout the past week, with all the “blue-chip” tokens seeing explosive momentum as…

The decentralized finance sector has posted massive gains throughout the past week, with all the “blue-chip” tokens seeing explosive momentum as bulls flood back into the embattled fragment of the crypto market at full speed.

This rebound first began when DeFi darling Yearn.finance’s YFI token hit lows of $7,500, at which point it incurred some massive momentum that sent it skyrocketing towards highs of $18,000.

It has since stabilized and is trying to post a high time frame close above this crucial level. If firmly broken and held above over an extended period of time, it could provide a base for it to grow upon that allows it to set fresh all-time highs.

In tandem with the price spikes seen by many crypto tokens within the ecosystem, liquidity providers’ yields on decentralized trading platforms have also rocketed.

This has justified the price movements seen by DeFi tokens and could create a tailwind to lift them higher.

One trader is now noting that he expects DeFi crypto assets to go on a “stupid run” in the near-term as the rest of the market shows continued strength.

He believes that the stability currently seen by Bitcoin, and a massive Ethereum rally, will incubate this next movement.

Crypto Market Stability Aids DeFi Rebound

The rebound seen throughout the larger DeFi tokens as of late can be seen while looking towards the DeFi perpetual index on FTX, which tracks the value of a handful of the top projects within the sector.

This contract bottomed at lows of $1,400 a couple of weeks ago and is currently trading at $2,160.

At its peak in late-August, the DeFi index reached highs of $3,500. Although it has a way to go before it reclaims these high, the recent lows are looking like a long-term bottom.

Analyst: DeFi Tokens Could Soon Rocket Higher

One analyst explained that he believes DeFi tokens are on the cusp of rocketing higher in the near-term, which will be incubated by Ethereum seeing a “stupid run.”

“Right now there is broad market strength in Defi blue chips, ETH, and Bitcoin. ETH looks like it wants to go on a stupid run. Send this and SNX YFI RUNE AAVE UNI all go bonkers to say the least,” he said.

Image Courtesy of Cantering Clark.

Where Ethereum trends next will undoubtedly influence the broader DeFi market. Any continued strength could send smaller tokens rocketing higher.

Featured image from Unsplash.
Pricing data from TradingView.