Ethereum Could Trigger a Massive “Altseason” Once It Taps This Key Level

Ethereum’s price action has been rather lackluster as of late, which has been surprising considering the deployment of the ETH 2.0…

Ethereum’s price action has been rather lackluster as of late, which has been surprising considering the deployment of the ETH 2.0 deposit contract and Bitcoin’s immense strength.

Many analysts pinpoint the weakness seen by Ethereum as the sole reason why altcoins have been bleeding out against both USD and BTC as of late.

Until Ethereum can surmount its resistance at $420, there’s a strong possibility that it will continue seeing signs of weakness and struggling to gain ground against Bitcoin.

One trader is now noting that ETH is approaching a crucial level against its Bitcoin trading pair that could offer investors with serious insight into its mid-term outlook.

He also notes that holding this support could single-handedly reverse BTC’s market dominance and spark the next altseason.

That being said, the lackluster response to the ETH 2.0 rollout could indicate that bulls are fundamentally weak.

Ethereum Struggles to Break Key Resistance Despite Bullish Developments

At the time of writing, Ethereum is trading up slightly at its current price of $410. This marks a notable surge from its lows of $380 that were set yesterday morning.

The rally from these lows came about due to the deployment of the ETH 2.0 deposit contract address.

For the highly anticipated network update to occur, the contract needs to reach the ETH threshold of roughly 525,000 ETH.

Once this threshold is reached, the Beacon Chain will be launched, and the full transition to ETH 2.0 will begin.

Although this has widely been seen as a bullish catalyst, bulls’ response to yesterday’s news was relatively lackluster.

The crypto remains well below its key $420 resistance that has been holding strong throughout the past few weeks.

ETH Could Soon Trigger a Massive Altseason

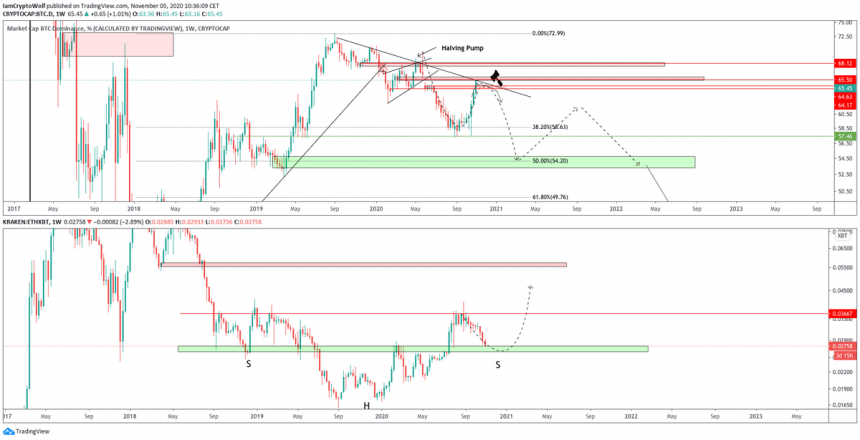
While sharing his thoughts on Ethereum’s near-term outlook, one analyst explained that it is about to reach a massive support level against its Bitcoin trading pair.

He notes that this could trigger the next altseason.

“To be clear. ETHBTC is approaching key support level, if support holds BTC.dominance will reverse. Once more: ETH season will trigger [altseason].”

Image Courtesy of Wolf. Source: ETHBTC on TradingView.

The coming few days should provide investors with significant insights into where Ethereum and the altcoin market will trend in the days and weeks ahead.

Featured image from Unsplash.
Charts from TradingView.

When Crypto’s Most Reliable Sell Signal Fails, The Bitcoin Bull Run Is On

Crypto traders rely on several tools to help predict future Bitcoin price action and trend changes. Few tools have been as…

Crypto traders rely on several tools to help predict future Bitcoin price action and trend changes. Few tools have been as reliable over the years as the TD Sequential indicator, created by market timing expert Thomas Demark.

The few times this tool has failed on the highest timeframes, Bitcoin has absolutely exploded in the months following. Is this time different and the sell signal its giving will be reliable? Or will this be the last chance to buy Bitcoin below its former all-time high of $20,000?

Bitcoin Triggers Rare Sell Signal That Once Failed Kicked Off The Bull Market

Bitcoin is one of the most volatile assets historically, due to its speculative nature and rise from literally nothing to nearly $20,000 in 2017.

The cryptocurrency is picking up steam again, and another bull market could be beginning. As the first of its kind, Bitcoin is just over a decade old and has only two previous bear markets to go on.

But both of those two previous bear markets, ended when the TD Sequential indicator on monthly timeframes, perfected an “8” sell setup, prior to also perfecting a “9” set up as well.

Related Reading | Bitcoin Quickly Approaches $15,000 As Election Outcome Lingers

Typically, a TD 9 signal suggests trends are nearing exhaustion, and the tool has been reliable all throughout the bear market on daily and weekly timeframes at calling tops and bottoms in Bitcoin and altcoins.

The highest timeframe signals are also usually the most dominant and effective when predicting the future trend. In the last two cases, however, the TD Sequential failed miserably on monthly time frames at calling the top, causing investors to potentially miss out on an over 8,000% rally.

Now, the signal is back, but is this time different?

The monthly TD Sequential indicator has perfected an “8” sell setup, and a “9” could be next | Source: BLX on TradingView.com

Fool Me Twice: Don’t Fall For the TD Sequential In A Crypto Bull Market

In 2013, when the TD Sequential indicator perfected an “8” and “9” sell setup, doing so would have been a grave mistake. Selling there would have missed an 8,000% rally.

Years later, when the more extended bear market ended, Bitcoin exploded by another 4,700% after the perfected setups. Again, selling would have been disastrous as an investor. During the 2017 rally, the TD Sequential even triggered a “13” countdown sell setup, which means the trend is severely overextended.

Related Reading | Bitcoin Hash Ribbons Trigger Rare Bull Market Capitulation Signal

Yet, it still couldn’t take Bitcoin down, and instead spiked from $3,000 to $20,000 five months later.

The TD “8” has been perfected, and another higher high next month would perfect the “9.” Then it is watch and wait, to see if the sell signal works this time or if another multi-thousand percent impulse move follows.

Featured image from Deposit Photos, Charts from TradingView.com

Chainlink Shows Signs of Weakness, But Development Activity is Bullish

Chainlink has been showing signs of weakness throughout the past few days, but this trend may be shifting as the cryptocurrency…

Chainlink has been showing signs of weakness throughout the past few days, but this trend may be shifting as the cryptocurrency rebounds today alongside Ethereum and other major altcoins.

The introduction of Ethereum 2.0 – with a scheduled release in December – is the event that is driving this rally. There’s a strong possibility that ETH’s ongoing break above $400 could mark a shift in the aggregated altcoin market.

This shift could work in Chainlink’s favor, although the cryptocurrency has a way to go before it can erase the losses it has seen over the past few days.

Where it trends next may depend largely on the sustainability of this ongoing ETH rally, as any sharp retrace could strike a serious blow to altcoins.

One analytics firm pointed out that Chainlink is still seeing large spikes in development activity, which is a positive sign that typically bodes well for an asset’s price action.

If this trend persists, the confluence of heightened development activity and strength amongst altcoins could send it rocketing higher.

Chainlink Attempts to Form a Long-Term Bottom as Bulls Step Up 

At the time of writing, Chainlink is trading up just under 2% at its current price of $10.60. This marks a notable rebound from its recent lows of $9.80 set just a few hours ago.

The rebound from this sub-$10.00 dip came about due to the strength seen by Ethereum.

ETH surged from $380 to over $400 this morning, with this rally coming about due to an announcement regarding Ethereum 2.0 launching in December.

If ETH shows signs of continued strength, money could begin rotating into altcoins and help sustain Chainlink’s tempered strength.

LINK Development Activity Remains High

Analytics firm Santiment explained in a recent tweet that Chainlink’s development activity has been rapidly rising.

They interpret this as a positive sign indicating that cryptocurrency is fundamentally strong – which could translate into technical strength.

“The development activity of LINK has been rising, according to the github data we track. Generally, when projects have an increase in their team’s true dev. rate as Chainlink has, it’s a positive sign for the asset’s sustainability & longevity.”

Image Courtesy of Santiment.

Where Chainlink trends next should depend largely on Ethereum and the rest of the altcoin market.

Featured image from Unsplash.
LINKUSD pricing data from TradingView.

Bitcoin Hits $14.2K after Biden Clinches Swing-State Votes

Bitcoin surged Wednesday towards its best level in the last three years, led by the prospects of Joe Biden winning the…

Bitcoin surged Wednesday towards its best level in the last three years, led by the prospects of Joe Biden winning the ongoing US presidential election.

The Democratic contender won the critical swing state of Wisconsin in the afternoon hours of the US trading session. His lead became critically important after Donald Trump logged a narrow win in other battleground states, including Texas, Florida, and Ohio.

So far, the outcome remained uncertain as other crucial states like Georgia, Michigan, and Pennsylvania continued to count votes. The latest readings showed that Mr. Biden is leading Mr. Trump by 248-211. They need at least 270 electoral votes to win the US presidency.

Biden, Bullish, Bitcoin

Meanwhile, Bitcoin traders continued to treat a leading Mr. Biden as their cue to stay bullish on the cryptocurrency. BTC/USD – throughout the voting tally period – tailed the Democrat’s performance. A lead for Mr. Trump slowed down its uptrend – and vice versa.

After Mr. Biden won Wisconsin, Bitcoin swang sharply towards $14,273. Nevertheless, the cryptocurrency quickly retreated its course, only to find short-term support near the $14,000 level.

Analysts agreed that a concise victory for Mr. Biden is bullish for Bitcoin. The candidate promised its voters that he would boost the government spending required to aid Americans through the economic aftermath of coronavirus.

That expects to put additional downward pressure on the US dollar, which, in turn, raises the prospects of higher Bitcoin bids.

But independent market analyst Michaël van de Poppe warned. He noted that the uncertainties surrounding the ongoing election’s outcome would make it difficult for Bitcoin to hold a rally above $14,000.

“Regardless of the outcome of the Presidential Election,” he added, “I’m heavily bullish on BTCand ETH long term.”

Bitcoin was trading at $14,051 at the time of this writing.

Yearn.finance (YFI) Faces a Meltdown as Analysts Eye Decline to $7,500

Yearn.finance’s embattled YFI governance token has been caught within a relentless downturn as of late that has been induced by immense…

Yearn.finance’s embattled YFI governance token has been caught within a relentless downturn as of late that has been induced by immense sell-side pressure, a fragmented community and declining protocol value.

The culmination of these various bearish factors has led analysts to expect significantly further downside in the near-term.

One trader is now noting that a decline towards $7,500 is likely imminent due to its inability to find any strong momentum as it slides beneath $10,000.

One recently passed governance proposal could bolster its outlook, as it redistributes the protocol’s income so that it goes towards market buying YFI tokens that can be used as community incentives.

It remains unclear whether or not this will create much buy-side pressure for the token, as the protocol’s earnings have been drying up due to limited liquidity rewards on platforms like Curve.

Yearn.finance’s YFI Struggles to Gain Momentum

Over the past few weeks, Yearn.finance’s YFI has been sliding lower and struggling to gain any momentum.

Bears have been in full control of its price action ever since it peaked at highs of $45,000 in early-September.

These highs came about in tandem with the DeFi sector’s peak, and the relentless selling pressure placed on YFI in the time since has been emblematic of the sector’s weakness.

At the time of writing, Yearn.finance’s YFI token is trading down just under 6% at its current price of $9,400.

This is around the price at which it has been trading throughout the past few days and weeks.

Because it is now trading firmly below its key $10,000 support level, there’s a decent chance that significantly further downside could be imminent in the near-term.

Trader Targets Move to $7,500 as YFI Shows Continued Weakness

YFI’s recent weakness is showing few signs of slowing down, as each relief rally has been heavily sold into.

Until the Yearn.finance ecosystem can begin capturing more value and directing that value towards those staking in the yVaults, there’s a strong possibility that further downside will be imminent.

One analyst stated in a recent tweet that he is targeting a move down towards $7,500 in the near-term.

“YFI – Short retest of $10,250. Target $7500,” he said while pointing to the below chart.

Image Courtesy of Mac. Source: YFIUSD on TradingView.

Unless there are serious underlying changes to the Yearn.finance ecosystem, there’s a strong possibility that further downside is imminent.

Featured image from Unsplash.
Charts from TradingView.
Bitcoin Hash Ribbons Trigger Rare Bull Market Capitulation Signal

An important fundamental health signal of the Bitcoin network just crossed into “capitulation” territory, which in the past was associated with…

An important fundamental health signal of the Bitcoin network just crossed into “capitulation” territory, which in the past was associated with downside risk. However, the tool’s creator says that it wasn’t designed to give sell signals, and shouldn’t be interpreted that way.

But because of how profitable its been used as a buy signal over the cryptocurrency’s history, it is difficult to ignore a sudden anomaly in the asset’s market cycle that has never in the past appeared. So what exactly is going on and why did this rare signal just trigger?

What Gives? Bitcoin Hash Ribbons Signal Miner Capitulation As Bull Market Begins

There is no other asset on the face of the planet like Bitcoin. Altcoins created in its honor, and even hard forks that as closely mimic the first ever cryptocurrency as possible can’t come close to its market share dominance and potential.

Cryptocurrencies in general, share very few similarities with traditional assets like stocks. Due to this, the fundamental analysis methods typically used to forecast company share pricing are useless.

Related Reading | Bitcoin Dominance Is Days Away From Triggering A 30% Rally Against Alts

Instead, custom tools have been designed by experts like Charles Edwards that closely monitor specific Bitcoin network health metrics, such as hash rate, and more. Edwards also created the hash ribbons, which in the past have acted as the ultimate buy signal for the top cryptocurrency.

Its signals are few and far between, but it has notably provided the runway for the rally to Bitcoin’s all-time high, and again to $14,000 both recent attempts.

 The hash ribbons indicator is signalling that miners are capitulating, but why? | Source: BTCUSD on TradingView.com

On average, hash ribbon buy signals result in roughly 5,000% return. But before the buy signal takes place, BTC miners must capitulate, which the hash ribbons signal with a crossover to the downside.

The tool’s creator warns that capitulation isn’t a signal to sell, but is it foolish to ignore a signal that in the past has been associated with some of the cryptocurrency’s most signfiicant downside?

Rare Capitulation Signal Appears For First Time Ever Post-Halving, But Why?

Since 2019 alone, this makes the fourth time miners have capitulated according to the hash ribbons. The first in 2019, was when Bitcoin fell to $6,000 in late December.

Black Thursday happened so fast, capitulation in this case came after the collapse itself. During this time, the top crypto asset traded way below the cost of production – another BTC fundamental tool Edwards has created.

Another captiulation event happened post-halving, just as the cost of production spiked above price action, but Bitcoin price quickly caught up.

Now, capitulation in BTC miners is back in the air. Most instances led to downside, some even severe. Prior to 2019, capituation of miners sent Bitcoin plummeting to its current bear market bottom of $3,200.

The hash ribbons indicator is signalling that miners are capitulating, but why? | Source: BTCUSD on TradingView.com

Crypto investors find comfort in comparing the last market cycle against the current, expecting similar results. However, according to the hash ribbons, things are already vastly different.

During the last bear market, the hash ribbons triggered three times. The short-lived bear market before it in 2012-2013 also had three distinct triggers.

Related Reading | Crypto Analyst: Altcoins To “Tank” While Bitcoin Runs For All-Time High

This time around, however, Bitcoin is working on its fifth time. Black Thursday was an acceptable anomaly that created an extra fourth fallout capitulating miners, but what is causing a fifth time? And will this be the final buy signal before the bull run when BTC miners have completed capitulating?

Each round of capitulation, in theory, shakes out weak miners leaving only the strongest to survive, in turn strengthening Bitcoin’s network and making the bull market more sustainable.

So even if Edwards is wrong and the tool can spot sell signals also, when the buy trigger arrives, it could be an opporotunity of a lifetime.

Note: To learn more about Bitcoin fundamental tools, including the hash ribbons indicator created by Charles Edwards, check out the recently launched NewsBTC crypto trading course.

Featured image from Deposit Photos, Charts from TradingView.com