Yearn.Finance closed last week with a strong rebound that left DeFi investors hopeful a bottom was in. However, from this weekend’s…
Yearn.Finance closed last week with a strong rebound that left DeFi investors hopeful a bottom was in. However, from this weekend’s high notes set on Friday and Saturday night, YFI has fallen over 20% and is now at risk of an even deeper decline. Here’s why.
Yearn.Finance Falls Over 20% From Weekend High Hangover
Due to Yearn.Finance’s finite, 30,000 token supply, the crypto asset is far more volatile than Bitcoin, or most other altcoins for that matter.
The asset rises and falls tens of thousands of dollars per week, as a result. The same volatility and scarce supply are responsible for YFI’s rise to its all-time high above $40,000, making it four times the price per BTC.
Yearn.Finance YFIUSDT Weekend DeFi Hangover Down 20% From Friday and Saturday Night Highs | Source: TradingView
That top was set when Yearn.Finance began trading on Coinbase, and early investors had a fiat gateway to cash out of. The fall and push and pull that’s followed, formed a massive head and shoulders pattern that has since broken downward.
And although a recovery did indeed look likely after a 60% rise from lows in less than a week, the pattern’s target was never reached, so more downside is still likely.
Average Directional Index Says DeFi and YFI Bear Trend Is Only Just Beginning
YFI could drop as deep as $10,000 or below, according to the target. Making matters worse, it could kick off an extended bear trend in Yearn.Finance, and through extension, potentially the greater DeFi space.
Crypto assets typically rise and fall together. For example, if Bitcoin suddenly tanked, it would bring down Ethereum and the rest of DeFi tokens down with it. Bitcoin “playing nice” would have kept YFI at higher prices, but the breakdown from $12,000 triggered the initial selloff.
Yearn.Finance YFIUSDT Average Direction Index Bear Trend Just Beginning | Source: TradingView
If the rest of the crypto market falls now, it could be the final push the Average Directional Index needs to confirm a bearish trend in YFI.
According to the tool, a reading of 20 or higher suggests a trend is growing in strength and likely to sustain higher. The trend is also likely to be bearish, as the red Directional Movement Indicator on the ADX is higher than the green, signaling negative price action ahead.
Bitcoin’s price saw a notable rebound today that allowed it to recover from an overnight dip and rally to fresh local…
Bitcoin’s price saw a notable rebound today that allowed it to recover from an overnight dip and rally to fresh local highs within the $11,500 region.
This push higher is promising because it is finally allowing Bitcoin to confront the crucial resistance it faces between $11,600 and $12,000, which is a resistance zone that analysts have been closely watching for quite some time.
If it breaks through this region in the coming days, it could signal that a fresh leg higher for the entire market is imminent, potentially sparking a serious bout of buying activity amongst investors who had been sitting on the sidelines.
That being said, one analyst is expressing caution when it comes to the crypto’s near-term outlook. He believes that until there’s a break above roughly $11,800, it is too early to flip fully bullish on BTC.
Bitcoin Shows Signs of Strength Following Overnight Decline
At the time of writing, Bitcoin is trading up over 1% at its current price of $11,500. This marks a notable surge from daily lows of $11,200 that were set overnight during a sharp selloff.
This attempted selloff didn’t last for long and didn’t quite fill the CME gap currently sitting within the $11,100 region.
Some analysts believe that this level will be filled before Bitcoin can see a sustainable uptrend, but traders said the same thing about the gap at $9,700 – which was never filled.
Where Bitcoin trends next will depend largely on how buyers handle the selling pressure that exists just above where the crypto is currently trading.
Any rejections here could be grave and potentially lead to a sharp fear-induced selloff, as analysts have been watching the resistance at $11,600 for quite some time.
Here’s the Key Resistance Zone to Watch
While sharing his thoughts on Bitcoin’s present outlook, one analyst explained that he is closely watching the price region between $11,600 and $11,800 due to the heavy selling pressure here.
“I was all for jumping into longs at mid 10k’s, while we were at a key support level. But now we are on the other end. Proceed with caution young bullas,” he said.
Image Courtesy of Credible Crypto. Chart via TradingView.
Where the entire market trends in the coming few days and weeks will likely depend entirely on its reaction to the selling pressure it faces just above its current price.
Featured image from Unsplash.
Charts from TradingView.
In the last few years, a dramatic uptick in online spending and e-commerce has led to a radical shift in the…
In the last few years, a dramatic uptick in online spending and e-commerce has led to a radical shift in the way online retailers and merchants reward their customers. It has also enabled more efficient cashback models that see customers earn a chunk of their order costs earned back by shopping through specialized cashback apps.
Traditionally, these cashback schemes offered shoppers cash or reward points for making purchases, but now blockchain technology and cryptocurrencies are beginning to disrupt the industry, enabling online shoppers to earn rewards in the most profitable asset class of the 21st century—cryptocurrencies.
Right now, the cryptocurrency cashback industry is dominated by two major players, StormX and Lolli. Here’s a quick look to help you choose which one best fits your needs, i.e StormX vs Lolli
StormX and Lolli at a glance
StormX is a platform that enables shoppers to earn crypto whenever they shop online from their favorite stores. The service is extremely simple to get started with, as users simply need to install the StormX browser extension or download the StormX app to their mobile device to begin earning cashback.
Image: StormX
Once installed, the StormX plugin works in the background and automatically tracks and provides users with cashback whenever they make a purchase through any of the supported merchants. StormX makes use of a flexible ‘Bolts’ reward system, which is used to shield users from cryptocurrency market volatility, while allowing users to withdraw their cashback in whichever cryptocurrency they choose, as and when needed—currently supported cryptocurrencies include Bitcoin (BTC), Litecoin (LTC), Ethereum (ETH), DAI and STMX.
Lolli, on the other hand, is a cryptocurrency cashback plugin that is available for Chrome, Firefox, and Microsoft Edge browsers. Like StormX, it allows users to earn cashback in the form of Bitcoin by making purchases on any of the supported websites and merchants. Once users activate cashback on their selected site, Lolli automatically tracks their reward and releases the designated mount of Bitcoin to their account after a holding period passes.
Users can withdraw rewards once their account balance hits $15 and the reward locking period has lapsed. Lolli also offers USD bank withdrawals for a low fee of $0.25.
Comparing StormX vs Lolli
Both StormX and Lolli have made major strides in pushing mainstream crypto adoption through their cashback schemes. Despite their similarities, their implementation, reach, and ecosystem differ somewhat.
Image: Lolli
For instance, as previously mentioned Lolli users can only earn cashback in BTC while StormX users can withdraw their rewards in six different cryptocurrencies. Also, StormX has a native mobile app and token (STMX)—two features completely lacking with Lolli.
Besides these, there are some fundamental differences that are important to consider when choosing the option that best works for you.
Lolli supports over 1,000 top brands from multiple industries, including global brands like Hotels.com, GAP, Best Buy, Marriott, Adidas, and Groupon. Users can earn a max cashback of almost 30% with Lolli, and Harry’s, Udemy, and Groupon currently offer the highest rewards at 27%, 13.5%, and 10.5% respectively.
Image: StormX
StormX has a similarly impressive list of more than 500 top global brands and thousands of stores supported on the platform, with new brands and offers added regularly based on user demand. For instance, between June and August 2020, StormX added over 160 more offers from some of the biggest global brands such as Nike, Alibaba, eBay, Topshop, and HP among others.
StormX offers as much as 87.5% cashback at some outlets, plus a whopping 20% cashback available at Nike. It also gives users the option to speed up their payouts by up to 75%—for those that need their funds in a hurry.
Our Verdict on StormX vs Lolli
Though many of their differences are subtle, each of these platforms is likely to appeal to different kinds of users.
Lolli provides a safe, simple, and fun way for users to get their hands on BTC while casually shopping online. For those that are familiar with using standard cashback apps, Lolli will likely feel immediately familiar and has a low barrier to entry.
On the other hand, StormX has built an entire ecosystem around its product, making for a much more complete solution for those looking to gain exposure to cryptocurrencies and earn cashback in their spare time. Unlike Lolli, StormX offers crypto rewards for completing micro-tasks through the mobile app. StormX also serves as a gateway to the highly profitable DeFi sector, where users can conduct token swaps, provide liquidity, and stake any STMX tokens they hold to further boost their earnings.
Overall, the StormX ecosystem offers a more holistic approach to cashback and crypto earnings, acting as both a simple passive earning opportunity and a bridge to the rapidly expanding cryptocurrency and DeFi industries. With close to 3 million downloads from users in over 180 countries and millions of dollars already issued in rewards, it’s safe to say that StormX is the best crypto cashback app out there—at least in our books.
For more such crypto news and updates , read more only at BUYUCOIN !
Ethereum started a steady increase above the $355 resistance against the US Dollar. ETH price tested the $380 resistance and it…
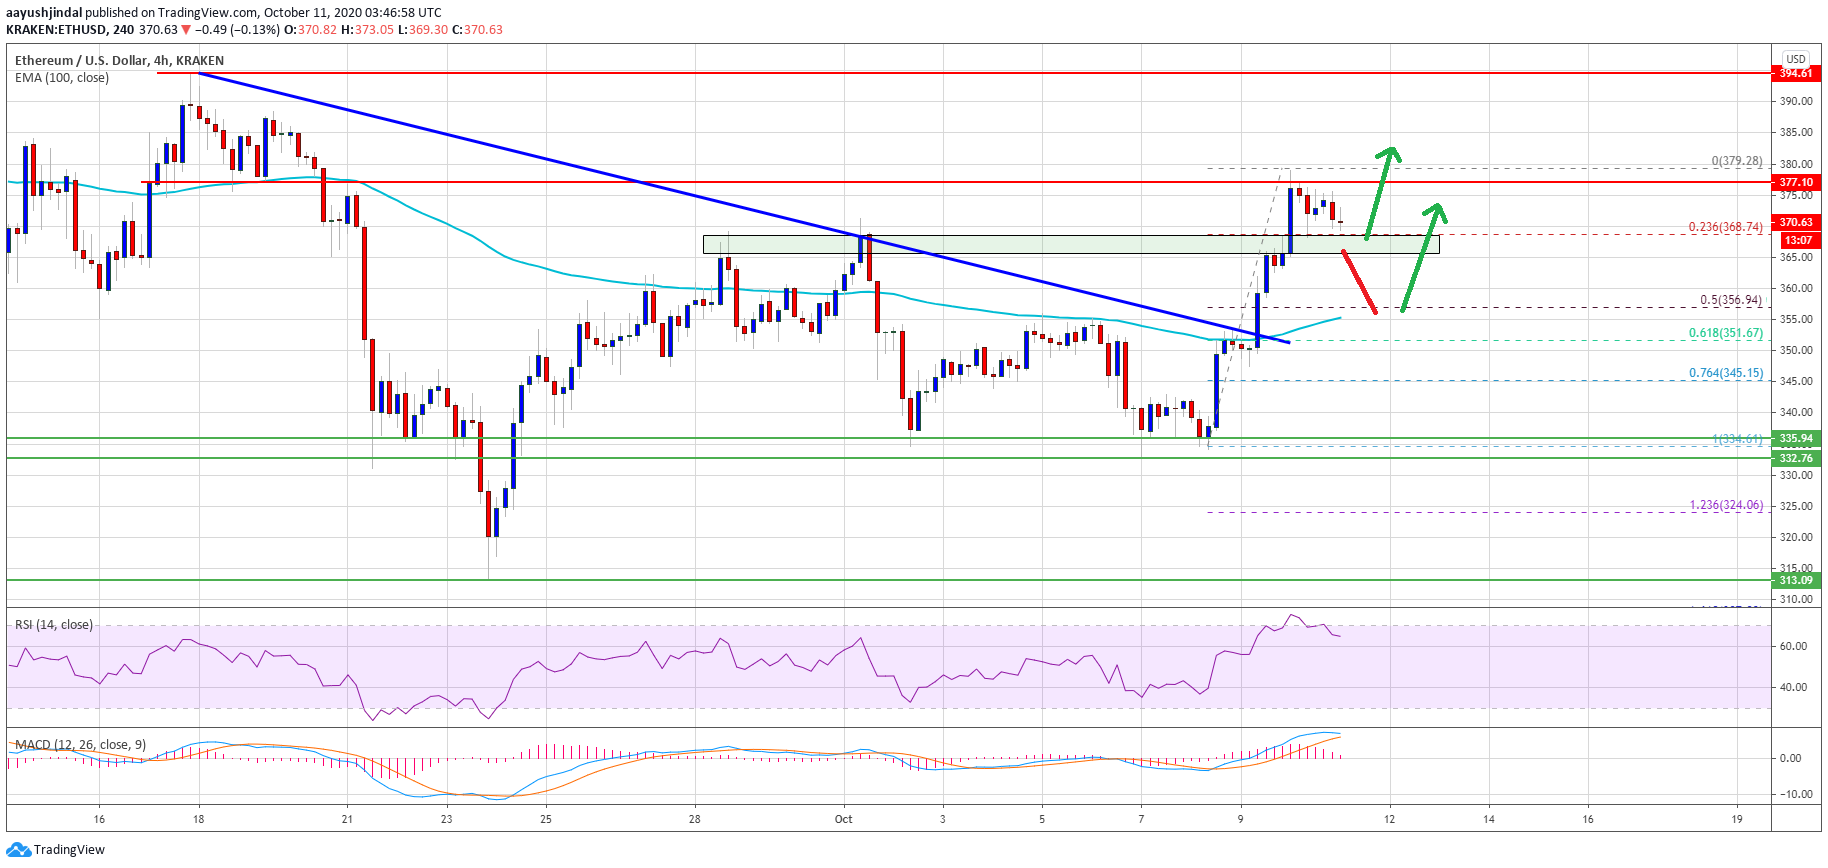
Ethereum started a steady increase above the $355 resistance against the US Dollar. ETH price tested the $380 resistance and it is currently correcting gains.
ETH price started a strong upward move after it clears the $355 resistance against the US Dollar.
The price ran into the $380 resistance, but it settled nicely above the 100 simple moving average (4-hours).
There was a break above a major bearish trend line with resistance near $354 on the 4-hours chart of ETH/USD (data feed via Kraken).
The pair could correct higher, but downsides might be contained near $355 or the 100 SMA (H4).
More importantly, there was a break above a major bearish trend line with resistance near $354 on the 4-hours chart of ETH/USD. Ether price rallied over $20 and it even broke the $370 resistance.
It faced a strong resistance near the $380 level (a multi-touch zone). A new monthly high is formed near $379 and the price is currently correcting gains. There was a break below the $375 and $370 level. The first key support is near the $368 level.
The 23.6% Fib retracement level of the recent upward move from the $335 swing low to $379 high is also near the $368 level. If there is a downside break below the $368 support zone, ether price is likely to continue lower towards the $355 support.
On the upside, the $380 level is another breakout zone. A clear break above the $380 resistance is likely to clear the path for more gains towards the $395 and $400 resistance levels in the coming sessions.
Dips Supported in Ether (ETH)?
If Ethereum fails to clear the $380 resistance zone, it might start a downside correction. An initial support for the bulls is near the $368 level.
The main support is now forming near the $355 level (the last breakout zone) and the 100 simple moving average (4-hours). The 50% Fib retracement level of the recent upward move from the $335 swing low to $379 high is also near the $356 level to provide support.
Technical Indicators
4 hours MACD – The MACD for ETH/USD is slowly losing pace in the bullish zone.
4 hours RSI – The RSI for ETH/USD is now well above the 60 level.
Major Support Level – $368
Major Resistance Level – $380
For more such news and updates , read only at Buyucoin !
पारंपरिक वित्तीय सेवा प्रदाता, बैंक, विशेष रूप से, प्रौद्योगिकी विकास की गति में पिछड़ रहे हैं। एक्सेंचर की एक रिपोर्ट के अनुसार, अधिकांश बड़े बैंक 1970 या 1960 के दशक से सिस्टम का उपयोग करते हैं, और ऑनलाइन या मोबाइल उपकरणों के माध्यम से बैंकिंग सेवाएं प्रदान करने में सहायता के लिए इस कंप्यूटिंग के शीर्ष पर नई कंप्यूटिंग तकनीकों को रखा गया है। इसका मतलब यह है कि धन का प्रमुख हिस्सा इन प्रणालियों की परिचालन स्थिति का समर्थन करने के लिए जाता है, न कि नवाचारों को पेश करने के लिए। यह, जबकि पुरानी प्रौद्योगिकियां अभी भी चल रही हैं, और उम्र के साथ चरमरा रही हैं।
यदि हम मोबाइल और इंटरनेट बैंकिंग तकनीकों को एक उदाहरण के रूप में पेश करने पर विचार करते हैं, तो आप देख सकते हैं कि ज्यादातर कंपनियां पहले निवेश करने से पहले एक निश्चित स्तर के प्रौद्योगिकी विकास की प्रतीक्षा करती हैं।
तथ्य यह है कि अधिकांश मौजूदा खिलाड़ी पुरानी तकनीकों का उपयोग करते हैं, उन कंपनियों के उद्भव में योगदान करते हैं जो नवाचार के माध्यम से वित्तीय सेवाओं को अधिक कुशल बनाते हैं, जो कुछ समय में पूरे वित्तीय उद्योग को बदल सकते हैं।
हालांकि, blockchain ने न केवल नई वित्तीय कंपनियों बल्कि पारंपरिक खिलाड़ियों का भी ध्यान आकर्षित किया है।
धन हस्तांतरण के पारंपरिक तरीकों के साथ मुद्दे
यद्यपि वैश्विक प्रेषण उद्योग बड़ा और अच्छी तरह से विकसित है, सीमा पार से भुगतान उद्योग की मुख्य समस्या बनी हुई है। सीमाओं के पार पैसा हिलाना एक धीमी और महंगी प्रक्रिया है। वैश्विक आर्थिक नियमों के कारण, जिनमें से कई मनी लॉन्ड्रिंग (एएमएल) के खिलाफ लड़ाई से संबंधित हैं, वित्तीय संस्थानों को इस तरह के भुगतानों को संसाधित करते समय एक जटिल नौकरशाही में ठीक से उन्मुख होना चाहिए, अंतर्राष्ट्रीय कानून के मानदंडों का पालन करना। इसमें काफी समय लगता है।
धन हस्तांतरण के लिए Blockchain
विश्व बैंक द्वारा कई लोकप्रिय ब्लॉकचेन से प्राप्त आंकड़ों के साथ दिए गए आंकड़ों की तुलना करने के बाद, यह पाया गया है कि “ब्लॉकचेन ट्रांसफर उनके पारंपरिक विरोधियों की तुलना में 127 गुना सस्ता है”।
Blockchain एक नई प्रकार की तकनीक है, जो ब्लॉक नामक रिकॉर्ड की बढ़ती सूची से संबंधित है। ब्लॉक की इस श्रृंखला में, प्रत्येक ब्लॉक पिछले ब्लॉक की सुरक्षित, क्रिप्टोग्राफिक जानकारी का रिकॉर्ड है। इसमें टाइमस्टैम्प और ट्रांसेक्शनल डेटा भी होता है।
यह एक वितरित बर्नर के रूप में कार्य करता है, जिसका अर्थ है कि यह अंतर-नोड संचार के लिए एक सामान्य प्रोटोकॉल का पालन करने वाले और नए ब्लॉकों को मान्य करने के लिए पीयर-टू-पीयर नेटवर्क पर रहता है। Blockchain तकनीक इस प्रकार दो पक्षों के बीच लेनदेन को मान्य करने के लिए एक विकेंद्रीकृत आम सहमति प्रदान करके काम करती है। यह किसी भी प्रकार के लेन-देन की घटना को रिकॉर्ड करने और मान्य करने के लिए एकदम सही है।
ब्लॉकचेन निम्नलिखित तरीकों से धन हस्तांतरण को प्रभावित करता है-
गति Blockchain एक वितरित खाता है और इसलिए, अब ऐसी भारी कतारों की जरूरत नहीं है जिसमें आम तौर पर नौकरशाही अनुमोदन शामिल हो, जो पूरी प्रक्रिया को भी थकाऊ बनाते हैं। Blockchain स्मार्ट कॉन्ट्रैक्ट्स पर संचालित होता है, जो कॉन्ट्रैक्ट में उल्लिखित शर्तों के अनुसार कोड और ऑटो की लाइनों में लिखा गया कॉन्ट्रैक्ट होता है। डेटा में प्रत्येक संशोधन को blockchain के योगदानकर्ताओं को सूचित किया जाता है। इसका मतलब यह है कि लेनदेन और डेटा में किसी भी परिवर्तन को वास्तविक समय में संप्रेषित किया जाता है। विदेशी मुद्रा हस्तांतरण को पूरा करने के लिए पारंपरिक तरीकों में अक्सर 2-3 दिन लगते हैं, जिसे blockchain के साथ मिनटों में हासिल किया जा सकता है। यह वैश्विक बाजारों को एकीकृत करता है और वैश्विक धन हस्तांतरण की सुविधा देता है।
समाशोधन और निपटान परंपरागत तरीकों से आदी होने वाला धन अक्सर वैश्विक धन हस्तांतरण के लिए कुल मिलाकर 7% लेनदेन लागत और अधिक तक जुड़ जाता है। लेन-देन को समाशोधन और निपटाने में शामिल बिचौलियों के कारण यह सर्वोत्कृष्ट है। यह वैश्विक रूप से स्थानांतरित होने पर सर्वव्यापी रूप से सहायक है, जो पारंपरिक रूप से समाशोधन प्रक्रिया और निपटान में देरी करता है। Blockchain का एक आदर्श मॉडल पूरी तरह से निवेश के नए अवसर खोल सकता है।
धन उगाहना Blockchain एक ICO देता है, जो कि IPO से बहुत मिलता-जुलता है | सिर्फ FIAT के जरिए फंड जुटाने के बजाय, आपको टोकन मिलते हैं, लेकिन यह प्रक्रिया बहुत ही कुशल और पारदर्शी है। एक बार जब ये जारी किए जाते हैं, तो उन्हें क्रिप्टो एक्सचेंजों पर कारोबार किया जा सकता है, जहां बाजार की ताकतें इसके बाद पारंपरिक स्टॉक मार्केट की तरह, टोकन के मूल्य का फैसला करती हैं। हालांकि, मौजूदा क्रिप्टो एक्सचेंजों को केंद्रीकृत किया जाता है, और इसका उद्देश्य विनिमय प्रक्रिया को और विकसित करने और इसे आसान बनाने के लिए विकेंद्रीकरण को बढ़ावा देना है।
सुरक्षित Blockchain एक वितरित खाता-बही है जिसमें हर नोड को डेटा के साथ एक हस्तक्षेप के साथ अधिसूचित किया जाता है। Proof of Work के माध्यम से उपयोगकर्ताओं द्वारा सब कुछ स्वीकृत किया जाता है, जिससे चीजें सुरक्षित हो जाती हैं। आपका अपने फंड पर पूरा नियंत्रण है। आपका धन हस्तांतरण पारदर्शी है क्योंकि आप वास्तविक समय में उनके आवंटन को सत्यापित कर सकते हैं। एक उपयोगकर्ता के रूप में, आप अधिक आत्मविश्वास महसूस करते हैं, जब आप हर कदम पर आश्वस्त होते हैं। चूंकि blockchain सिस्टम हैशिंग का उपयोग करता है, यह एक एकल बिंदु विफलता से बचकर हेरफेर के जोखिम को कम करता है। यह प्रणाली को साइबर हमलों से कम प्रभावित करता है, एक आम सहमति नेटवर्क के साथ ब्लॉकचैन की भावना को विकेंद्रीकृत मंच के रूप में संरक्षित करता है।
प्रस्तावित प्रणाली
a. वॉलेट तैयार करना: क्रिप्टो-मुद्राओं में, सिक्का स्वामित्व को लेनदेन के रूप में ब्लॉक श्रृंखला पर स्थानांतरित किया जाता है, प्रतिभागियों के पास एक पता होता है जिसे धन भेजा जा सकता है और स्वीकार किया जा सकता है। अपने मूल रूप में वॉलेट केवल इन पतों को संग्रहीत कर सकते हैं, अधिकांश वॉलेट, हालांकि, blockchain पर नए लेनदेन करने में सक्षम सॉफ्टवेयर भी हैं।
b. लेन-देन और हस्ताक्षर: प्रत्येक लेनदेन एक निश्चित मात्रा में डेटा ले जाएगा-निधि भेजने वाले की सार्वजनिक कुंजी। वह हस्तांतरित किए जाने वाले धन का मूल्य / राशि, इनपुट जो पिछले लेनदेन के संदर्भ हैं जो यह साबित करते हैं कि प्रेषक के पास भेजने के लिए कुछ धन हैं, आउटपुट जो लेनदेन में प्राप्त प्रासंगिक पते की संख्या दिखाते हैं, एक क्रिप्टोग्राफ़िक हस्ताक्षर जो यह साबित करता है कि मालिक पता इस लेनदेन को भेजने के लिए जिम्मेदार है, और यह कि डेटा नहीं बदला गया है।
c. एक blockchain एक दूसरे से जुड़े ब्लॉक की एक श्रृंखला है: एक हैश एक ऐसा फ़ंक्शन है जो किसी भी लंबाई के इनपुट स्ट्रिंग को बदलने और एक निश्चित लंबाई के आउटपुट को बाहर करने में परिवर्तित होता है। बिटकॉइन जैसी क्रिप्टो मुद्राओं के संदर्भ में, लेनदेन को इनपुट के रूप में लिया जाता है और हैशिंग एल्गोरिथ्म के माध्यम से चलाया जाता है (बिट सिक्का SHA-256 का उपयोग करता है) जो एक निश्चित लंबाई का आउटपुट देता है। Hashing
विधि को एक गणितीय फ़ंक्शन के माध्यम से ब्लॉक से डेटा को संसाधित करने की आवश्यकता होती है, जिसके परिणामस्वरूप एक निश्चित लंबाई का आउटपुट होता है। निश्चित लंबाई आउटपुट का उपयोग करने से सुरक्षा बढ़ जाती है क्योंकि जो कोई भी हैश को डिक्रिप्ट करने की कोशिश कर रहा है वह यह नहीं बता पाएगा कि आउटपुट की लंबाई को देखते हुए इनपुट कितना लंबा या छोटा है।
d. टाइमस्टैम्प: टाइमस्टैम्प एक कालानुक्रमिक क्रम में जुड़े ब्लॉकों को प्रदर्शित करेगा। यह blockchain पर हर एक लेनदेन के लिए समय संग्रहीत करता है। निर्माण की ट्रैकिंग को सुरक्षित रखने और दस्तावेज़ को संशोधित करने की प्रक्रिया व्यापार की दुनिया के लिए एक अनिवार्य उपकरण है। यह इच्छुक दलों को संदेह के बिना दस्तावेज़ के बारे में जानने की अनुमति देता है। टाइमस्टैम्प एक नोटरी की भूमिका निभाता है, और यह एक पारंपरिक की तुलना में अधिक विश्वसनीय है।
निष्कर्ष
इस प्रकार, यह कहा जा सकता है कि blockchain में धन हस्तांतरण सुरक्षित रूप से संग्रहीत किया जाएगा। इस प्रकार के ब्लॉकचेन में, सभी उपयोगकर्ताओं को हर लेनदेन का पता चल जाएगा। कोई तीसरा पक्ष ऐसे लेनदेन में शामिल नहीं है। Blockchain प्रौद्योगिकी विधि का उपयोग करके, भाग लेने वाले दलों को विश्वास हो सकता है कि समझौते के दोनों सिरों पर राशि का हस्तांतरण किया गया है और हस्तांतरण मूल्यों पर सहमत हुए प्राप्य हैं।
Bitcoin has surged higher over the past 48 hours due to positive fundamental trends. The cryptocurrency, which traded as low as…
Bitcoin on-chain trends as surged higher over the past 48 hours due to positive fundamental trends. The cryptocurrency, which traded as low as $10,400 just a week ago, now trades for $11,400. Less than a few hours ago, the coin was trading just shy of $11,500.
BTC’s ongoing move higher has convinced many analysts that a larger bull trend is brewing under the surface. Coin Metrics, a top blockchain analytics and data firm, made this much clear just recently.
The firm released an extensive Twitter thread noting that while there were fundamental factors that drove lower this past month, Bitcoin is strong from an on-chain perspective. They shared a handful of metrics indicating that BTC is in a very similar spot now as the coin was prior to 2017’s exponential explosion.
Bitcoin Bull Trend Is Brewing: CoinMetrics Analysis
Coin Metrics, a top blockchain analytics firm, recently shared a swath of metrics indicating that Bitcoin remains in a long-term bull trend despite any uncertainty in the near term:
Bitcoin MVRV, which attempts to track the profitability of the average BTC investor, is “also holding the same trajectory it did during the 2016/17 bull market.”
The supply of BTC on exchanges is starting to decrease at a strong pace. This suggests that there are more BTC holders, which should drive prices higher over time as on-exchange demand dries up.
” Despite the recent volatility, the number of Bitcoin whales continues to increase, indicating the growing number of large holders that have positive expectations for the future of Bitcoin.”
1/9 Bitcoin has performed remarkably these past few weeks despite: -Most of DeFi falling 50-80% -CFTC charging BitMEX -POTUS contracting Covid -Delayed stimulus talks -FCA announcing a derivative ban for retail
Analysis indicates that the leading cryptocurrency has a lot of room to grow from here.
A crypto-asset chartist recently shared this chart below, which suggests that each of BTC’s macro rally highs has all formed at a Fibonacci extension ending in “0.272.” The analysis suggests that the next cryptocurrency’s high will be approximately $270,000, around 2,500% above current prices.
This optimistic analysis lines up with the sentiment shared by many other in the space. Investors like Dan Tapiero and Raoul Pal, of Gold Bullion Int. and Real VIsion, respectively, both think that the cryptocurrency will undergo an exponential rally during this market cycle.
Brave New Coin Bitcoin Liquid Index Fibonacci Extension Predicts Next Peak | Source: TradingView
Featured Image from Shutterstock
Price tags: xbtusd, btcusd, btcusdt
Charts from TradingView.com
3 Bitcoin On-Chain Trends Show a Macro Bull Market Is Brewing
For more news and updates , view our Crypto blogs handle and stay updated !