A. अपना पासवर्ड बदलने के लिए इस लिंक पर क्लिक करें: https://trade.buyucoin.com/forgotPassword B. अपना ईमेल दर्ज करें और “reset” बटन पर क्लिक करें| C. आपको अपने पंजीकृत ईमेल पर reset link मिल जाएगा। D. अपना पासवर्ड reset करने के लिए लिंक का अनुसरण करें।
यदि आप पहले से logged in हैं
1. प्रोफाइल पेज खोलें और सिक्योरिटी पर क्लिक करें।
‘Change Password’ पर जाएं |
2. टैब पर क्लिक करें |
पासवर्ड reset करने के लिए इन चरणों का पालन करें
A. अपना वर्तमान पासवर्ड दर्ज करें (Forgot password) B. अपना इच्छित पासवर्ड डालें और पुनः प्रवेश करके पुष्टि करें |
Ripple failed to extend gains above $0.2580 and declined sharply against the US Dollar. XRP price is likely to decline heavily…
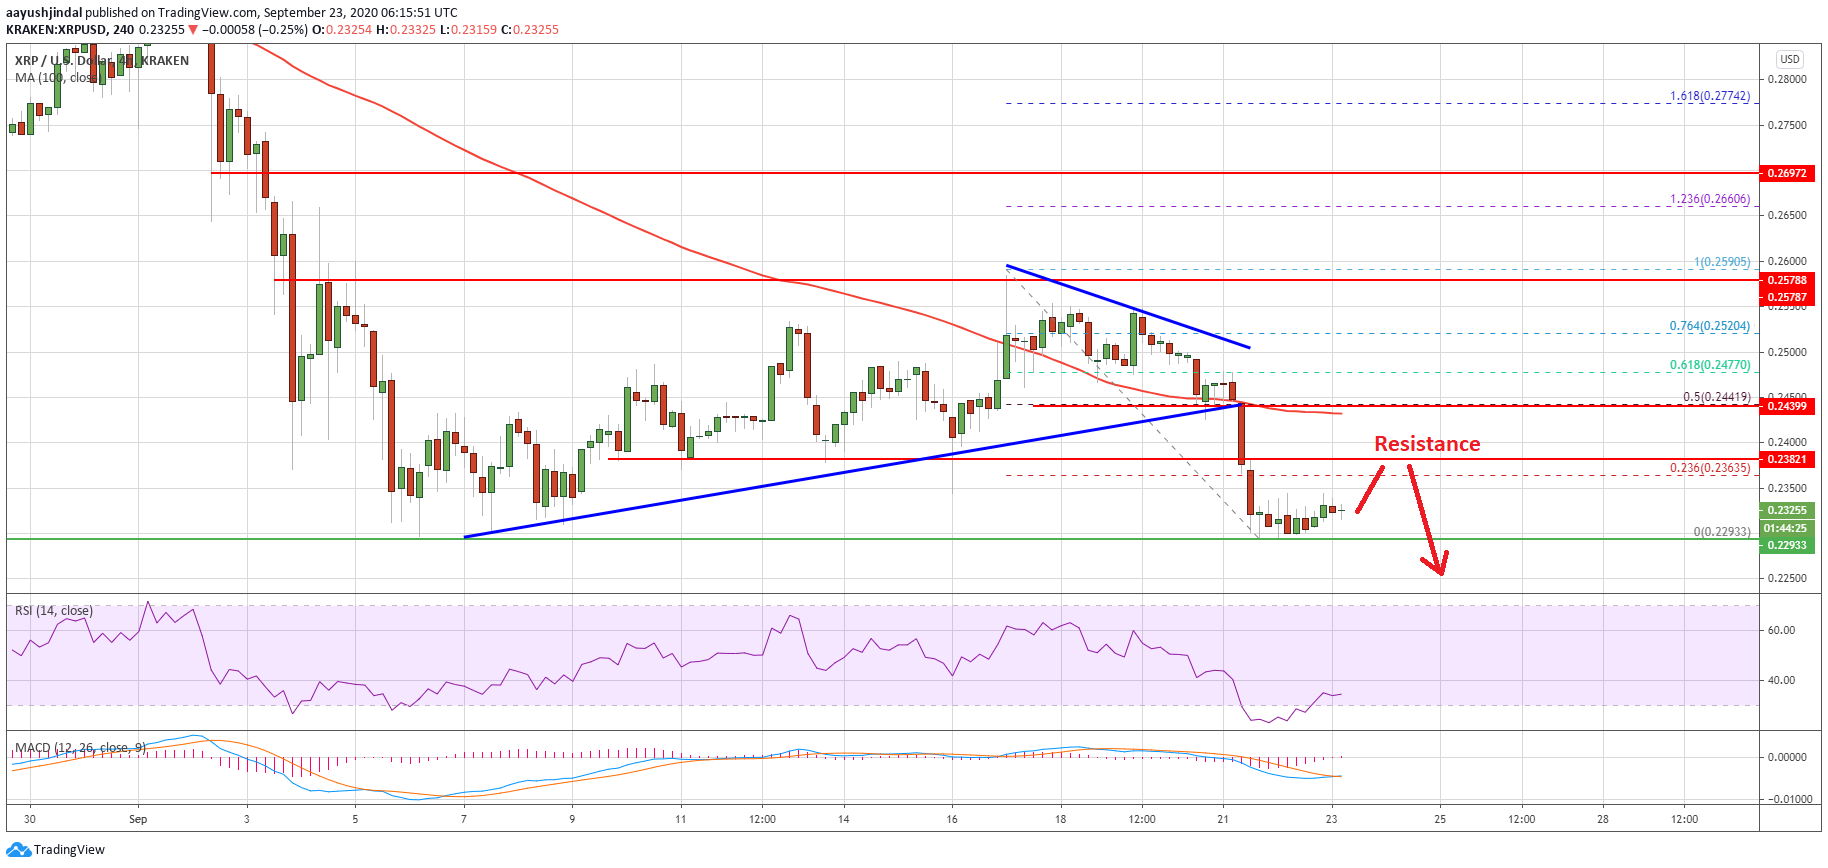
Ripple failed to extend gains above $0.2580 and declined sharply against the US Dollar. XRP price is likely to decline heavily if it breaks the key $0.2300 support zone.
Ripple is now trading well below the $0.2400 and $0.2380 support levels against the US dollar.
The price is facing many hurdles and it is now well below the 100 simple moving average (4-hours).
There was a break below a crucial bullish trend line with support near $0.2440 on the 4-hours chart of the XRP/USD pair (data source from Kraken).
The pair is likely to decline sharply if there is a close below $0.2300 and $0.2280.
Ripple Price is Testing Important Support
This week, we saw a fresh decline in bitcoin, Ethereum, and ripple. XRP price failed to stay above the $0.2500 and $0.2450 support levels, and moved into a bearish zone.
There was a sharp decline after there was a close below the $0.2440 support and 100 simple moving average (4-hours). More importantly, there was a break below a crucial bullish trend line with support near $0.2440 on the 4-hours chart of the XRP/USD pair.
The pair even traded below the $0.2320 support and traded as low as $0.2293. It is currently consolidating losses above a significant support zone near $0.2290-$0.2300.
On the upside, an initial resistance is near the $0.2360 level or the 23.6% Fib retracement level of the recent decline from the $0.2590 swing high to $0.2293 low. The main resistance is near the $0.2440 level (the recent breakdown zone) and the 100 simple moving average (4-hours).
The 50% Fib retracement level of the recent decline from the $0.2590 swing high to $0.2293 low is also near the $0.2440 level. A successful close above the $0.2440 resistance and the 100 SMA is must for a decent upward move in the near term.
More Losses in XRP?
If ripple fails to recover above the $0.2400 and $0.2440 resistance levels, there is a risk of more losses. The main breakdown support is forming near the $0.2290-$0.2300 zone.
A downside break and close below the $0.2290-$0.2300 zone could start a sharp decline. The next main support is near the $0.2200 level, below which the price could accelerate lower towards $0.2120.
Technical Indicators
4-Hours MACD – The MACD for XRP/USD is slowly losing pace in the bearish zone.
4-Hours RSI (Relative Strength Index) – The RSI for XRP/USD is well below the 50 level.
Major Support Levels – $0.2300, $0.2290 and $0.2200.
Major Resistance Levels – $0.2365, $0.2400 and $0.2440.
Ethereum is struggling to recover above the $345 and $350 resistance levels against the US Dollar. ETH price is likely to…
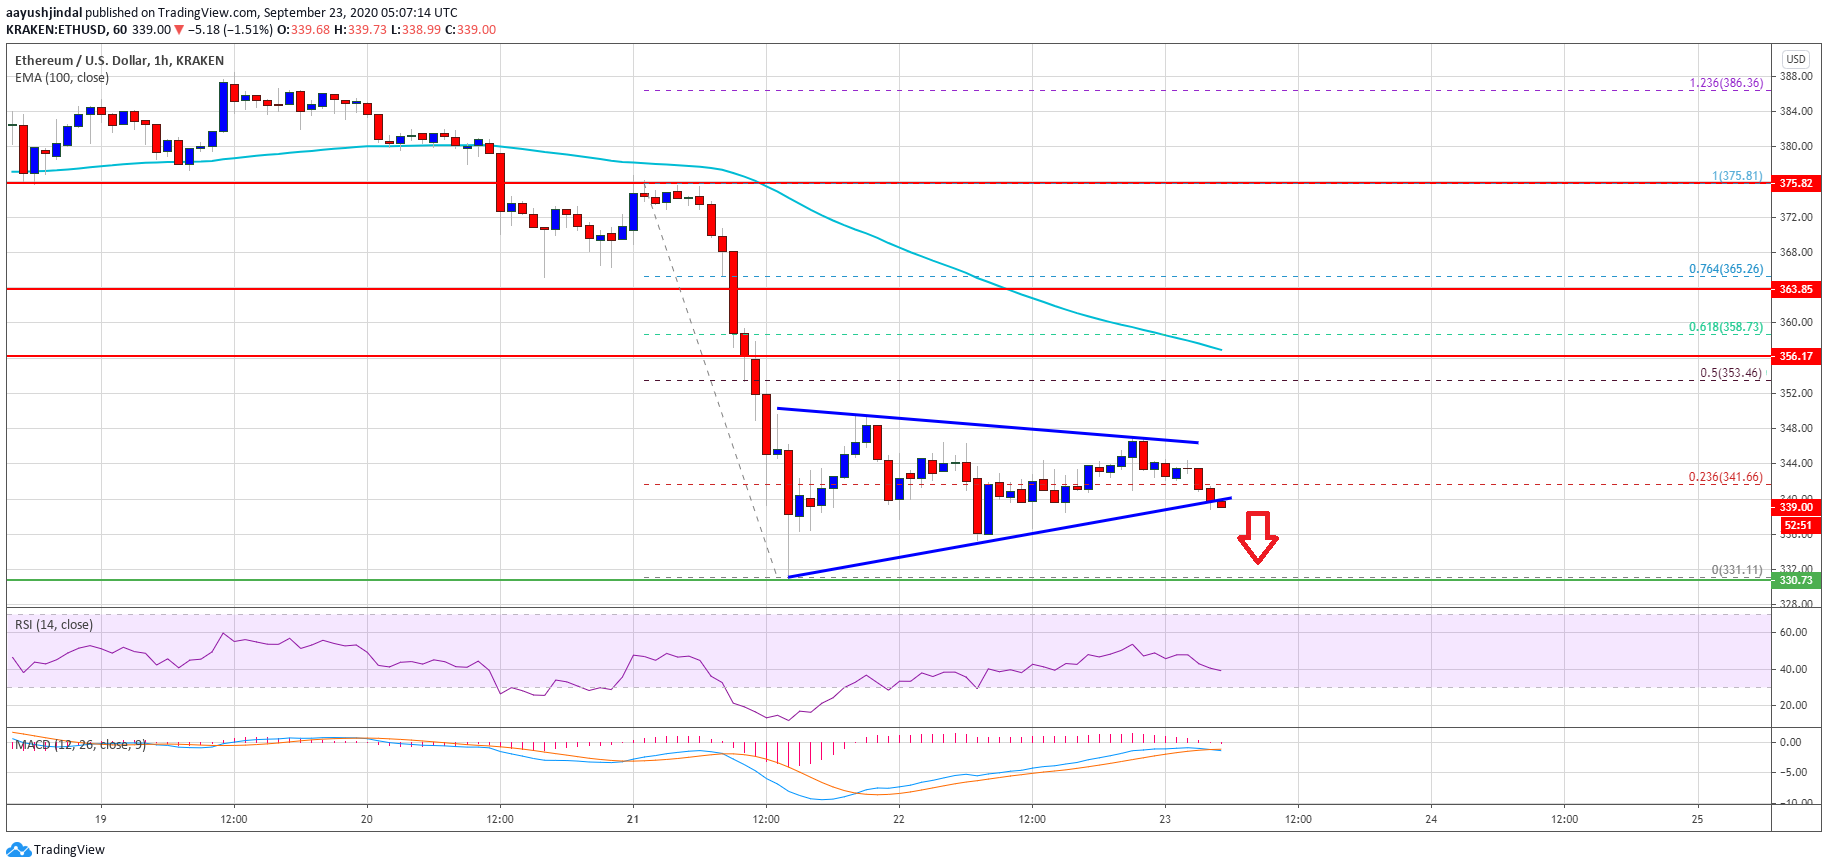
Ethereum is struggling to recover above the $345 and $350 resistance levels against the US Dollar. ETH price is likely to continue lower below $330 unless it recovers above $355.
Ethereum corrected a few points higher, but it failed to climb above the $350 level.
The price is declining below $345 and it is well below the 100 hourly simple moving average.
There was a break below a key contracting triangle with support near $340 on the hourly chart of ETH/USD (data feed via Kraken).
The pair is likely to continue lower and it could even break the $330 low.
Ethereum Price Could Accelerate Losses
Yesterday, we saw a sharp decline in Ethereum below the $355 support level. ETH price even broke the $340 level and settled well below the 100 hourly simple moving average.
It traded to a new weekly low at $331 and recently started an upside correction. There was a recovery wave above the $340 level. Ether price even climbed above the 23.6% Fib retracement level of the downward move from the $375 high to $331 low.
However, the price struggled to continue above the $350 resistance. It remained well below the $355 resistance, and the 50% Fib retracement level of the downward move from the $375 high to $331 low.
There was a fresh bearish reaction and there was a break below a key contracting triangle with support near $340 on the hourly chart of ETH/USD. The pair is currently trading just below $340 and facing an increase in selling pressure.
If the price continues to move down, there is a risk of more losses below the $331 low and $330. The next major support is near the $320 level, below which the price may even retest the $310 support.
Upsides Capped in ETH?
If Ethereum starts a fresh recovery wave, it could face hurdles near the $350 level. The first major resistance is near the $355 level (the last key breakdown zone).
A successful close above the $355 resistance might push ether further higher. In the stated case, there are chances of a decent recovery above the $365 and $370 levels in the coming sessions.
Technical Indicators
Hourly MACD – The MACD for ETH/USD is slowly moving in the bearish zone.
Hourly RSI – The RSI for ETH/USD is still well below the 50 level.
UNI logged a rollercoaster opening session last week after rising by almost 2800 percent in just less than 24 hours. The…
UNI logged a rollercoaster opening session last week after rising by almost 2800 percent in just less than 24 hours.
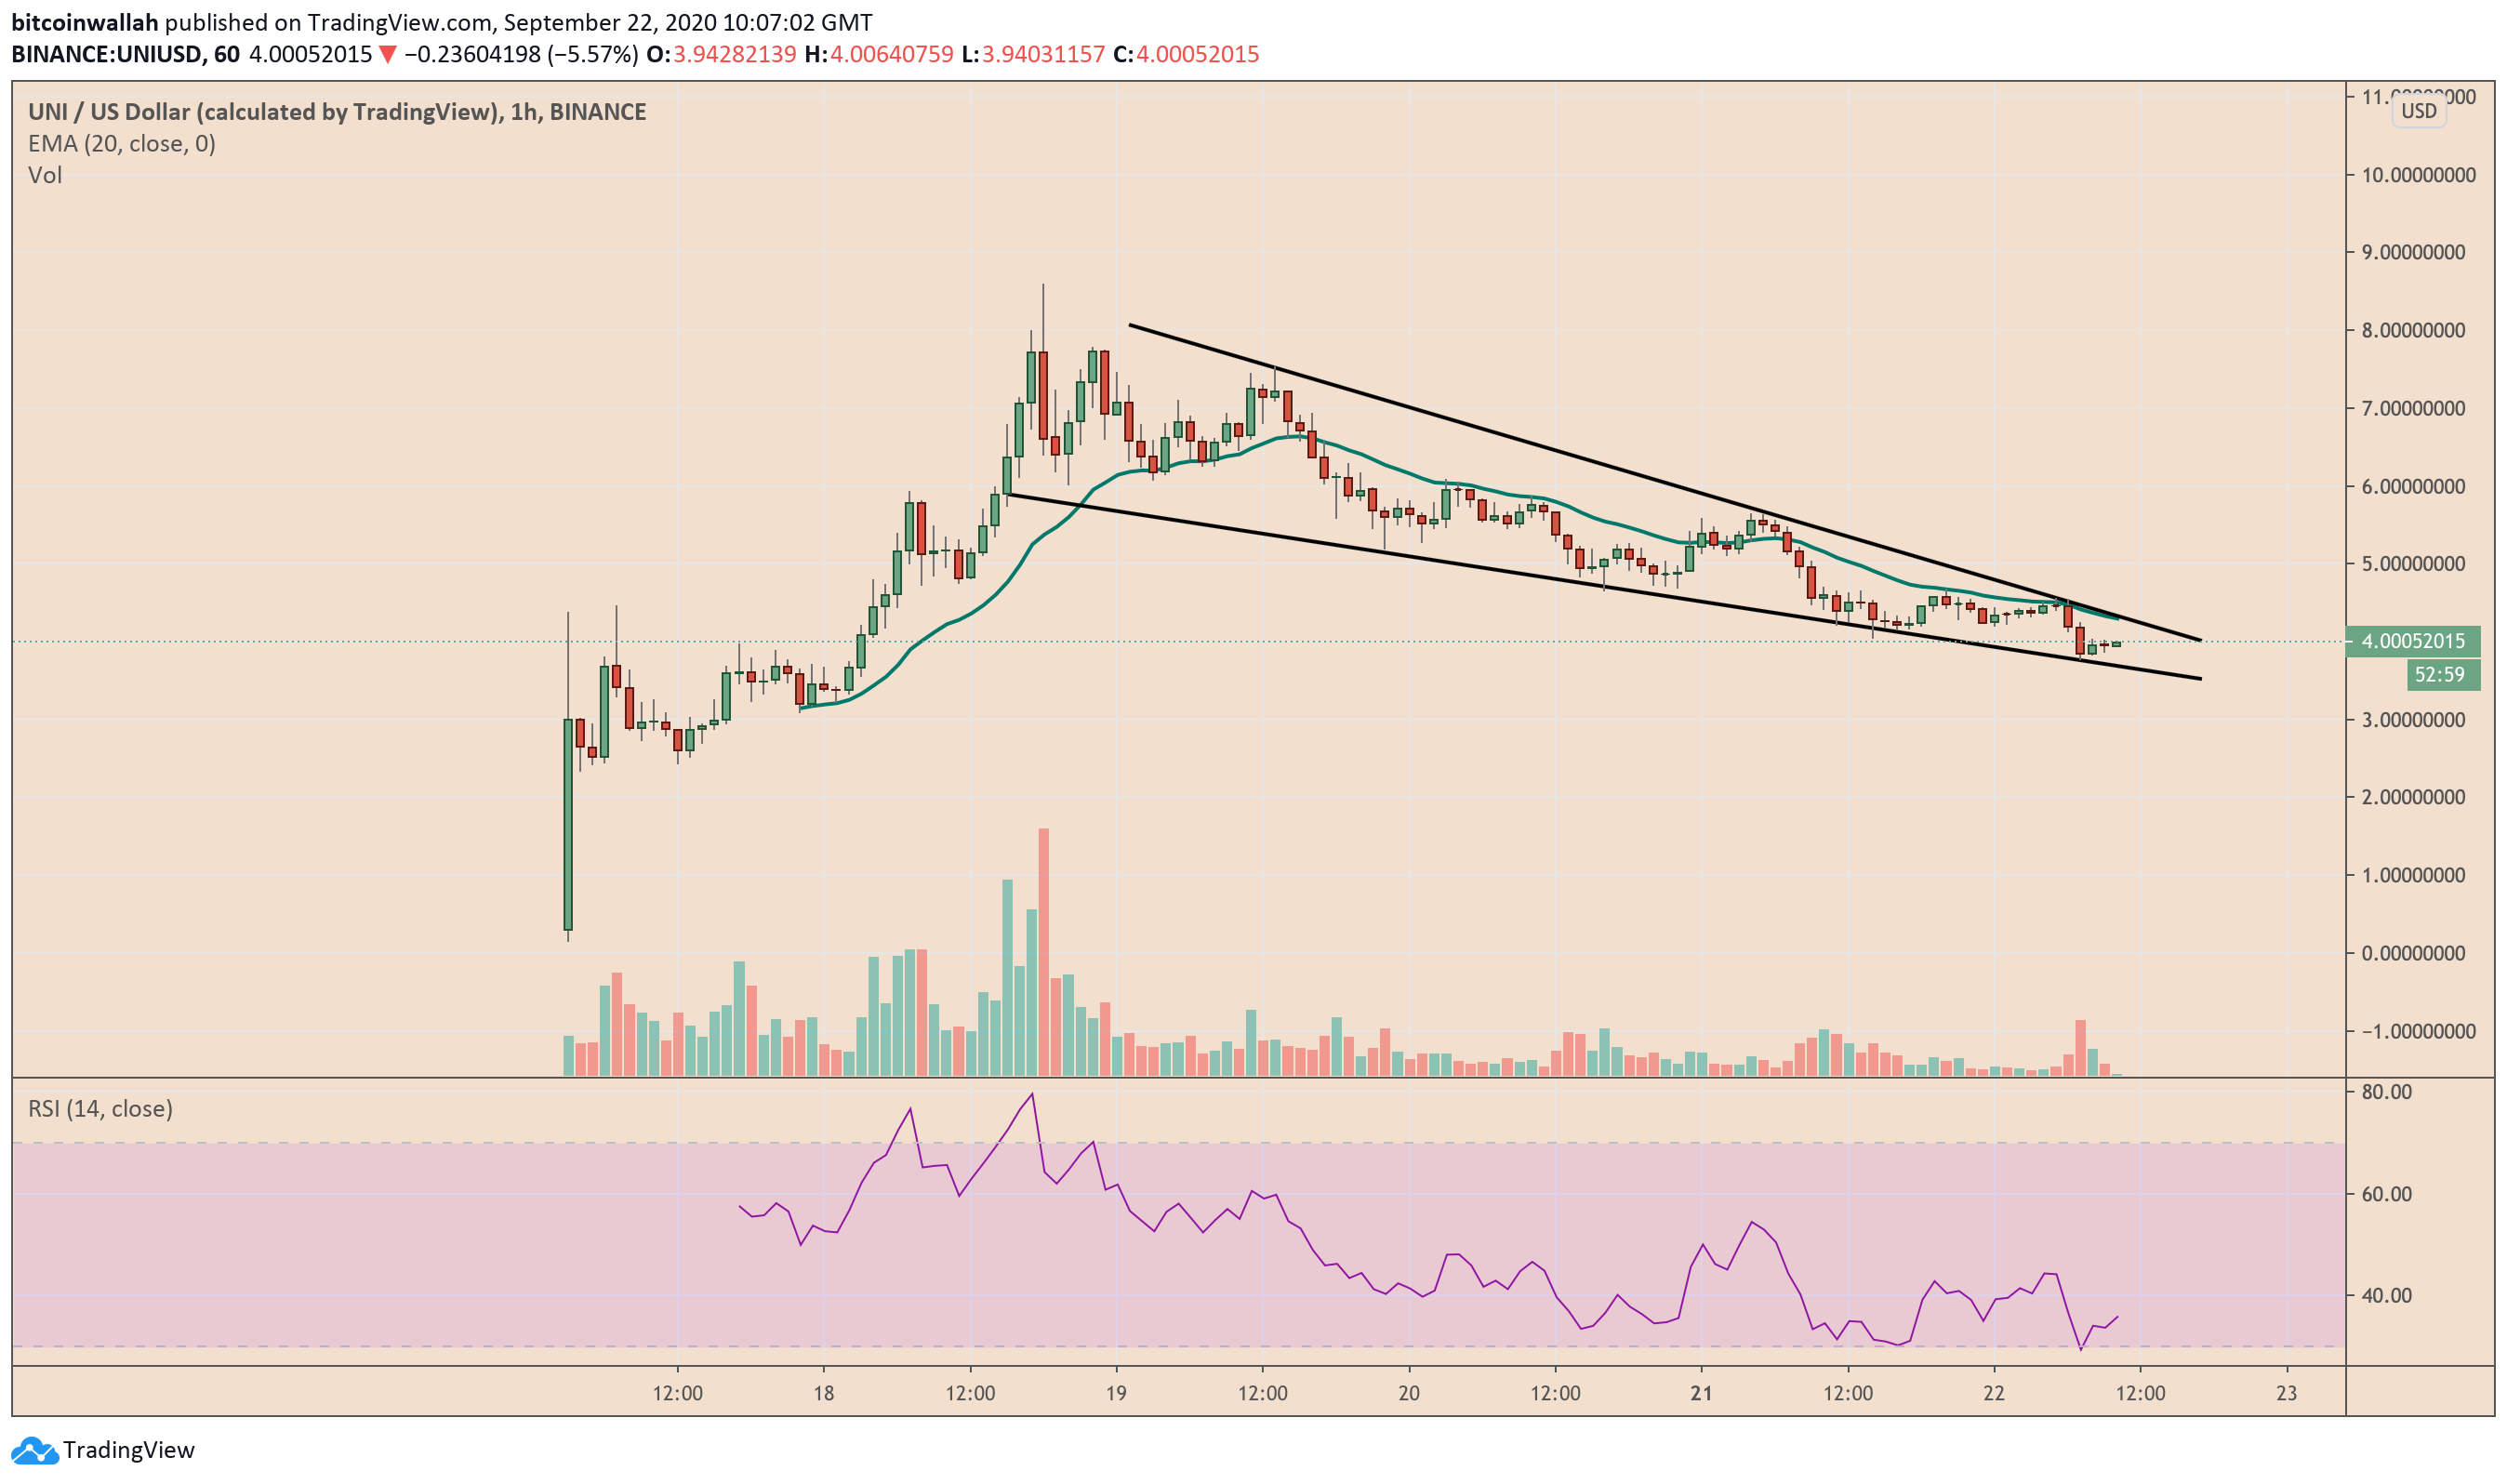
The token reached a record level of $8.59 following its free distribution among the users of UniSwap, a top decentralized cryptocurrency exchange by volume. It supplied about 150 million UNI tokens to its liquidity providers, traders, and SOCKS token holders.
Nevertheless, UNI came under severe selling pressure as beneficiaries started dumping it in open markets to secure maximum profits. The result was a 50 percent downside correction, as shown in the chart below.
UNI loses half its gains against the US dollar. Source: TradingView.com
Technically, the UNIUSD rate formed a Falling Wedge pattern (black) as it fell lower in the last few days. It is a bullish reversal indicator that begins wide at the top and contracts as prices move lower. Eventually, the asset breaks out of the Wedge area to the upside to retest the pattern’s top (~$8).
Fundamentals
UNI expects to find buyers at lower levels due to its parent project, UniSwap’s feasibility as a sustainable decentralized finance project. It utilizes an automated market-making system instead of a traditional order-book. Users pool together two assets that they trade against one another according to the price determined by the ratio between the two.
UniSwap provably solves the issue of high spreads for illiquid assets on order-book exchanges by providing incentives to market makers. They can earn attractive returns by merely depositing their crypto-assets to UniSwap’s audited liquidity tool.
The exchange worked without a governance token so far. But an emerging competitive threat in the name of SushiSwap led the UniSwap team to launch UNI. The token holders can now use it to govern the UniSwap protocol.
That aspect expects to add value to UNI. The UniSwap team has clarified that it would distribute the tokens to their users until it exhausts the supply limit of 1 billion UNI in the next four years. Meanwhile, traders can also sell or purchase UNI now across multiple exchanges, including Binance, Coinbase, OKEx, Huobi, and others.
What UNI Technicals Say
As a newbie token, UNI has no relevant trading history that could reveal potential entry/exit levels.
So far, a 20-hourly moving average wave is serving as a price target depending on the direction of the trade. Meanwhile, the Falling Wedge pattern stressed on a fluctuation downtrend for a while, with its levels acting as support and resistance.
The token’s hourly Relative Strength Indicator points to a price recovery as its momentum reading flashes “oversold.” UNI, therefore, could be in the process of bottoming out before logging a sharp retracement price rally.
It’s been a tough past few days for the crypto market, especially for Ethereum-based coins. From their recent highs, most decentralized…
It’s been a tough past few days for the crypto market, especially for Ethereum-based coins. From their recent highs, most decentralized finance coins based on Ethereum have crashed by 30-50%, plunging as capital has rushed to the sidelines.
The best example of the correction is Yearn.finance (YFI), a cryptocurrency that is core to the DeFi ecosystem. Since peaking at $44,000 just weeks ago, the coin has corrected by nearly 50% to $24,000 as of this article’s writing.
Not all coins are suffering from recent price weakness, though.
In fact, there’s an altcoin literally called MEME that is up around 1,500% in the past week, “defing’ the odds.
Ethereum-Based Coin Surges 1,500% in a Week Despite Crypto Correction
The Ethereum-based MEME cryptocurrency has gained around 1,500% in the past week, rallying from approximately $120 to $1,900 as of this article’s writing. That is a gain of 1,483% in the span of seven days, making it likely one of the best-performing crypto-assets in the multi-million-dollar market cap range.
MEME is the native asset of MEME, a platform where users can transact and buy so-called “non-fungible tokens” (NFTs). NFTs have many use cases but in the case of MEME, users can buy and transact rare trading cards that contain unique art, often of popular DeFi trends.
MEME is required to create Pineapples, which in turn can be spent to buy these rare NFTs.
The reason why MEME has appreciated so heavily in the past week is that NFTs have caught fire. Not only are MEME’s trading cards worth a lot, NFTs on other platforms have regularly been selling for dozens or even hundreds of Ethereum.
Chart of MEME's price action over the past week or so. Chart from Chartex and TradingView.com
Now that it’s been outlined what the project does, it’s worth taking some time to look at the odd origins of the project.
MEME was created by accident — really.
ConsenSys’s Jordan Lyall posted the tweet below in August, which contained an image of a theoretical platform where users could rapidly spinup forks of the top DeFi projects with just a few clicks.
This was a joke, which Lyall made clear later. But some users liked the idea and thus created a Telegram channel for the concept.
After some internal debates after a few dozen members joined, an Ethereum token was created called MEME, then distributed to the users of that Telegram channel.
In that group were builders and artists that decided to abandon Lyall’s original concept in exchange for digitized memes.
What’s especially crazy about this story is that the airdrops for the few dozen in the Telegram channel are now worth over $500,000 each.
Photo by Brooke Lark on Unsplash Price tags: ethusd, ethbtc Charts from TradingView.com DeFing the Crypto Drop, this Ethereum Coin Is Up 1,000% in a Week
The European Centre for Disease Prevention and Control has issued a stark notice over the rise in infection rates. As a result, throughout Europe, authorities are taking into consideration the possibility of a second lockdown.
With that, some analysts and industry observers are warning that a sudden market crash could be on the cards in the near term.
Rich Dad, Poor Dad author, Robert Kiyosaki, believes a market crash is imminent. In a recent tweet, he drew attention to the underlying problem of crippling US debt.
Despite his pessimism, he still maintains the view that long term, the anti-fiats will come out on top.
What happens when vaccine is proven? Gold silver Bitcoin will CRASH. Buying opportunity. Real problem NOT Pandemic. Real problem massive US debt. US Bankrupt. $28 T balance sheet debt. $120 T off balance sheet social obligations. Gold silver Bitcoin best investments long term.
Although May’s halving seems like a long time ago, the immediate effect of it saw mining difficulty drop as scores of miners were unable to sustain profitable operations.
Cutting rewards in half was enough to drive small miners, with inefficient equipment and/or high costs, out of the mining game.
Some believed the mining exodus would trigger a death spiral for the price of Bitcoin. At the time, Zach Resnick, Partner at VC firm Unbound Capital, painted a picture of woe from the drop off in mining difficulty. He summarized it as follows:
“As the halving cuts the block reward, a large number of miners will leave the network. As the network hash rate drops, the block time increases, the network becomes congested. This, in turn, makes Bitcoin less attractive, as participants do not want to wait forever to have their transactions processed. This leads to the Bitcoin price falling, which pushes more miners off the grid. This process repeats itself until the network dies.”
With yesterday’s jump in mining difficulty, more miners than ever before are working to secure the Bitcoin network. This decisively puts paid to any notion of a mining death spiral as a result of the halving.
What’s more, historical data shows there is a degree of positive correlation between Bitcoin mining difficulty/hash rate and the BTC price.
However, regardless of miner’s optimism, the bigger picture cannot be ignored entirely. As such, the longs should proceed with caution.


 Near Crucial Juncture: Here’s Why It Could Decline Sharply 5")