YFI Expects Big Trouble as Price Falls Six Days in a Row

It is day six and YFI has not stopped falling from its all-time high above $44,000. The Yearn Finance’s governance token…

It is day six and YFI has not stopped falling from its all-time high above $44,000.

The Yearn Finance’s governance token remains among the best-performing crypto-assets in 2020, with lifetime gains near 2,000 percent. Nevertheless, its higher-than-expected price has also reduced its bids in the open market. That has resulted in a sharper decline.

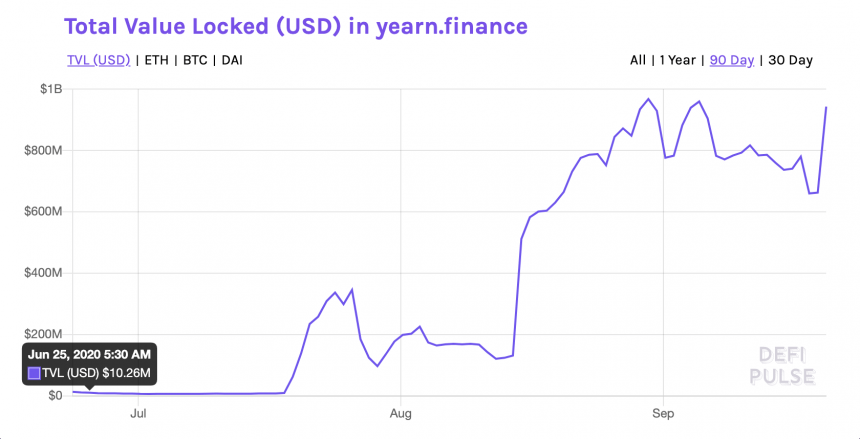
YFI/USD dropped another 15 percent during the Monday session, marking $22,495 as its intraday low. That brought the pair down by almost 48 percent from its all-time high. At the same time, the total value locked inside the pools of Yearn Finance moved towards $950 million. It is now on the verge of hitting a record level.

Total value locked in the Yearn Finance pool. Source: DeFi Pulse

The ballooning liquidity pool and falling prices expressed conflict between YFI’s fundamental and technical aspects. While a $950 million worth capital reserves showed that more users were choosing Yearn Finance for its lending aggregator services, the demand for the product failed to excite traders in increasing their exposure in YFI.

The YFI-Yield Farming Connection

Part of the reason could be an underperforming yield farming sector itself. Yearn Finance, as a project, aggregates lending services such as Aave, Compound, Fulcrum, and DyDx, to find the best yields for its users. So when a user deposits his/her tokens into the yearn.finance pool, they receive yTokens in return.

Meanwhile, people who provide a certain amount of yTokens back to Yearn Finance receive YFI, a cryptocurrency that gives users the right to make changes in the yearn.finance protocol via on-chain proposals and voting.

Therefore, demand for YFI depends on the yTokens liquidity. So it appears, not many yTokens holders are demanding YFI. Sam Bankman-Fried, the CEO of crypto derivatives exchange FTX explained:

“On the one hand, I think people don’t realize that while YFI itself isn’t yield farming, it’s revenue comes from yield farming, so it’s still really tied to it. So it crashes with farming.”

The analyst, meanwhile, added that he remains long-term bullish for YFI because its creator, Andre Cronje, keeps building new applications around it.

“So though I’m bearish on YFI as it exists right now, YFI might become something much more powerful over time,” he added. IDK, YFI seems much more like a bet on @AndreCronjeTechthen a bet on @iearnfinanceto me.”

Technically Bearish

Despite favorable fundamentals, YFI/USD expects big trouble ahead as the pair breaks below a multi-week support trendline.

The Yearn Finance token is logging a Head and Shoulder breakout. Source: TradingView.com

So it appears, the green price support was serving as a base to a Head & Shoulders pattern, as confirmed by three back-to-back peaks with the middle one longer than the rest. YFI/USD broke below the neckline on Sunday, now pointing to an extended move downwards.

Ideally, the downside target should be as much as the height of the middle peak. But given YFI’s lack of trading history, it is possible that traders attempt a pullback move at the Fib retracement levels below. It starts with $23,927, and shifts lower towards $19,429, $13,025, as so on.

A retracement move would prompt traders to attempt a close above the green trendline.

Top 5 Cryptocurrency Price Predictions Weekly #10 21st to 26th Sep 2020

Cryptocurrency price predictions presented by buyucoin on weekly based in INR, such as Bitcoin ( BTC), Ethereum ( ETH), Ripple ( XRP), Litecoin ( LTC), and Bitcoin Cash ( BCH). Our technical analytics trading experts will guide you, how should your trading plan be for the coming week?

  1. Bitcoin Price Prediction 14th to 19th Sep
  2. Ethereum Price Prediction 14th to 19th Sep
  3. Ripple Price Prediction 14th to 19th Sep
  4. Litecoin Price Prediction 14th to 19th Sep
  5. Bitcoin Cash Price Preditcoin 14th to 19th Sep

Lets See…

Benefits Of Cryptocurrency Weekly Technical Analysis

Bitcoin Price Prediction 21st to 26th Sep

As anticipated BTC did hold the 10k region and move towards the 11600$, which we had predicted, since the full move has not commenced the prediction is the same for this week as well.

We will likely to see the 11600-12000$ region one final time before coming back down to the 9000$ region.

We should be taking profits at these points in time in the markets if we have dollar-cost averaging our buys in the lows and wait for the next potential buy opportunity when we come back down.

Ripple Cryptocurrency Price Prediction 21st to 26th Sep

Nothing has changed for the XRP as well, XRP is also consolidating in between 22-25 cents regions from 3 weeks now and will still likely to continue for a few days as well, but that doesn’t mean our upside targets are invalidated. They are just taking longer than usual to meet.

40 cents will most likely occur for the XRP, we have already averaged our buys in the lows of 20 cents so there is nothing much to worry right now.

Ethereum Price Prediction 21st to 26th Sep

ETH did maintain the 350$ level of support but has not fully moved to the projected regions.

Here’s what should happen with the ETH right now, ETH will likely push towards the 420-450$ and then we will say a significant amount of drop to the downside towards the 260$ region.

Taking profits right now is much more favorable and patiently waits for the next buy zones, that’s what we must be doing right now.

Litecoin Price Prediction 21st to 26th Sep

If I analysis Of Litecoin cryptocurrency price prediction, LTC still holding up the 45$ support floor and has not moved much from the last few weeks, due to its underperforming behavior right now in the market it will most likely to wick fish to the upside zones which is located at around 75-80$ region, which will trick most of the people in the market and then come back to the same zone where we currently are.

For this pair, I would suggest to wait for the upside zones to meet and dollar cost average in these regions.

Bitcoin Cash Price Prediction 21st to 26th Sep

Among the 5 currencies, BCH has not moved much this month and is likely to hold the current level of support for longer than we thought, we should be accumulating the BCH at this level of support as BCH looks bullish for the short term period and will likely to rocket ship to the 300$ region before going back down further.

If you want to become a cryptocurrency trader registered your self on BuyUcoin live webinar session Click Here

Ethereum is Struggling Near $400, But 100 SMA Could Trigger Bullish Break

Ethereum recovered above the $380 and $385 resistance levels against the US Dollar. ETH price is struggling to clear the $400…

Ethereum recovered above the $380 and $385 resistance levels against the US Dollar. ETH price is struggling to clear the $400 resistance, but it is holding the key 100 SMA (H4).

  • ETH price is trading well above the $360 and $375 resistance levels against the US Dollar.
  • The price traded to a new weekly high at $395 and it is above the 100 simple moving average (4-hours).
  • There is a key bullish trend line forming with support near $374 on the 4-hours chart of ETH/USD (data feed via Kraken).
  • The pair is likely to continue higher above $400 as long as it is above the 100 SMA (H4).

Ethereum Price Holding Uptrend Support

This past week, Ethereum remained in a positive zone above the $360 resistance against the US Dollar. ETH price even managed to surpass the $380 resistance zone to move further into a positive zone.

Ether price traded to a new weekly high at $395 and it is now well above the 100 simple moving average (4-hours). The price is currently correcting lower and trading below the $385 level. There was a break below the 23.6% Fib retracement level of the upward move from the $353 low to $395 high.

On the downside, the first major support is near the $376 level and the 100 simple moving average (4-hours). There is also a key bullish trend line forming with support near $374 on the 4-hours chart of ETH/USD.

Ethereum price trades above $380. Source: TradingView.com

The trend line support coincides with the 50% Fib retracement level of the upward move from the $353 low to $395 high. On the upside, the price is facing hurdles near the $395 and $400 levels. A successful close above the $400 resistance zone is needed for a fresh rally towards the $420 level or $425.

Downsides Supported in Ether (ETH)?

If Ethereum fails to clear the $400 resistance zone, it might continue to move down. An initial support is near the $375 zone or the 100 simple moving average (4-hours).

If there is a downside break below the trend line support and the 100 SMA, there is a risk of a larger decline towards the $355 and $350 support levels in the near term.

Technical Indicators

4 hours MACD – The MACD for ETH/USD is losing pace in the bullish zone.

4 hours RSI – The RSI for ETH/USD is still above the 50 level.

Major Support Level – $375

Major Resistance Level – $400

Bitcoin Price is Primed For a Rally And Only 1 Thing is Holding it Back

Bitcoin is showing positive signs above the $10,800 support against the US Dollar. BTC broke the $11,000 level and it is…

Bitcoin is showing positive signs above the $10,800 support against the US Dollar. BTC broke the $11,000 level and it is currently correcting lower towards key supports.

  • Bitcoin gained pace and traded to a new weekly high at $11,176.
  • The price is currently correcting below $11,000, but it is well above the 100 simple moving average (4-hours).
  • There are two major bullish trend lines forming with support near $10,900 and $10,800 on the 4-hours chart of the BTC/USD pair (data feed from Kraken).
  • The pair is likely to continue higher above $11,000 as long as there is no close below $10,800.

Bitcoin Turns Green

This past week, bitcoin started a steady rise above the $10,650 and $10,800 resistance levels against the US Dollar. BTC even broke the $11,000 level and settled well above 100 simple moving average (4-hours).

A new weekly high is formed near $11,176 and the price is currently correcting lower. There was a break below the $11,050 and $11,000 levels. Bitcoin even traded below the 50% Fib retracement level of the recent increase from the $10,818 low to $11,176 high.

On the downside, there are couple of important supports near the $10,800 level. There are also two major bullish trend lines forming with support near $10,900 and $10,800 on the 4-hours chart of the BTC/USD pair.

Bitcoin price breaks $11,000. Source: TradingView.com

The first trend line is close to the 76.4% Fib retracement level of the recent increase from the $10,818 low to $11,176 high. The second trend line is near the previous breakout zone at $10,800 (a strong support).

On the upside, the bulls are struggling to gain pace above $11,000 and $11,100. A successful close above the $11,200 level might clear the path for a push towards the $11,500 resistance or even $11,800.

Dips Supported in BTC?

If bitcoin struggles to climb above the $11,000 resistance, it might continue to move down. The main support on the downside is near the second trend line and $10,800.

A clear break and close below the $10,800 support level may perhaps lead the price towards the next major support near the $10,550 level. Any further losses might call for a test of the $10,200 level.

Technical indicators

4 hours MACD – The MACD for BTC/USD is slowly moving into the bearish zone.

4 hours RSI (Relative Strength Index) – The RSI for BTC/USD is still well above the 50 level.

Major Support Level – $10,800

Major Resistance Level – $11,200

Ethereum’s Market Dominance is Poised to Surge; Here’s How Uniswap May Fuel It

Ethereum has been at the center of some of the largest developments within the crypto market throughout the past several weeks…

Ethereum has been at the center of some of the largest developments within the crypto market throughout the past several weeks and months.

Nearly the entire DeFi ecosystem is built upon the Ethereum blockchain, which has driven massive demand for blockspace on the network. This has caused gas fees to rocket to all-time highs, with the trend showing few signs of slowing down anytime soon.

Despite the massive amount of capital that has flooded the DeFi ecosystem, it is imperative to note that this has not been fully reflected in ETH’s price action, as the cryptocurrency has remained somewhat stagnant as of late.

This may soon change, as one analyst is noting that he is expecting the cryptocurrency to see a massive surge in its dominance over the market in the near-term. He specifically believes it may rally as high as 17-18%.

There’s a possibility that Uniswap’s token launch will help fuel this.

Analyst: Ethereum Market Dominance to Surge Towards 18%

Ethereum’s price has been stagnant below $400 throughout the past few weeks, with buyers being unable to break back above this key level.

It is important to note that the selling pressure found around this key price region has catalyzed multiple harsh rejections, although ETH is finally beginning to garner some sustainable upwards momentum.

Whether or not it is able to hold above $380 could be the factor that determines its near-term outlook.

One trader believes that Ethereum will gain against the rest of the market, potentially rallying enough to cause its market dominance to hit 18%.

“ETH dominance is heading to 17-18% and there is nothing you can do to stop it,” he said while pointing to the chart seen below.

Image Courtesy of Wolf. Chart via TradingView.

Here’s How Uniswap’s Token Launch Could Fuel ETH’s Dominance Rise 

Demand for Ethereum may be disproportionate to that of Bitcoin and other cryptocurrencies in the near-term.

This could be due to liquidity providers looking to earn UNI tokens buying ETH to stake it in the four pools offering Uniswap token incentives.

Each of these four pools requires Ethereum as one of the pairs, which means investors must have, or acquire, ETH to become an LP.

Already these pools have a collective total value locked of nearly $1 billion, which amounts to $500 million worth of ETH.

As this number grows, it could place further buy-side demand on Ethereum, and there’s a decent chance that the vast majority of this ETH will be held onto for the next two months while the UNI incentives remain intact.

Featured image from Unsplash. Chart and pricing data via TradingView.

Bakkt To The Futures: Last Year’s Hottest Bitcoin Platform Breaks All-Time

A blast from Bitcoin’s past is making a comeback, reaching a new all-time highs trading volume after abysmal launch turnout sent…

A blast from Bitcoin’s past is making a comeback, reaching a new all-time highs trading volume after abysmal launch turnout sent the cryptocurrency’s price tumbling last year.

What’s going on with Bakkt that suddenly has its Bitcoin Futures trading desk soaring in trading activity?

Bakkt The Truck Up: Remembering The Reason For Crypto’s 2019 Collapse

Last year, Bitcoin’s safe haven narrative first took shape, as the cryptocurrency began to rally alongside gold as tensions mounted between the US and China.

Little did investors know, those buying up those safe haven assets then were actually preparing for a pandemic and hyperinflation as a result of the stimulus efforts to battle it.

Related Reading | These Key Levels And Dates Could Invalidate Bitcoin’s Stock-To-Flow Model

Regardless of the outcome this year, last year’s Bitcoin rally turned out to be a dud in the end. And support at $10,000 then was ultimately lost due to the launch of the much anticipated Bakkt Future trading desk, falling on its face.

The Intercontinental Exchange owned, physically delivered Bitcoin Futures contracts platform was to be the next big thing to hit crypto, that was said to open the flood gates to institutional adoption.

Except when the platform launched, there was barely trace of activity. Bitcoin price plunged through $10,000 after weeks of trading above it, and it has taken until now to get back above.

Why Is Trading Volume Surging On The Bitcoin Futures Trading Desk?

But Bitcoin price is back above $10,000, and a year later here we are. At the same time, however, Bakkt trading volume is rising, and has even set a new all-time high of over $175 million in trading volume.

It’s not clear why there’s suddenly interest in Bitcoin on Bakkt, after a year of stagnancy. However, all growth needs to begin somewhere, and it is possible it has taken this long for institutions to get onboarded and take notice of the platform.

Related Reading | Bitcoin Crossroads Made Clear By Two Remaining Lines in The Sand

Or perhaps, it’s the recent move from hedge fund managers, and even corporations like MicroStrategy who are hedging against the coming inflation, that has inspired traders on Bakkt to place bets on Bitcoin through Futures contracts.

BTCUSD Bakkt Launch September 23 & Losing $10,000 Support | Source: TradingView

Interestingly, Bakkt reaching all-time high comes just after Bitcoin price retestied the exact support level, to the candle, that was lost on September 23 when Bakkt first launched.

That line, has acted as the crypto asset’s strongest resistance yet, and thus far, it has held this time as support.  If it continues to hold, Bitcoin may see a new all-time high alongside Bakkt’s surging record trading volumes.