Bitcoin is more bullish than ever, and Ethereum has taken center stage of the hot to trot DeFi trend. XRP, however, has remained a laggard for two years running. But all this could soon change, as a signal just triggered on the Ripple versus Bitcoin trading pair that in the past has led to an on average increase of just under 80%.
Could Ripple’s woes soon reverse against Bitcoin, and could XRP finally regain all the ground it has lost over the last two and a half years of a bear market?
TD 9 Buy Setup Triggers On High Timeframe XRP Price Charts
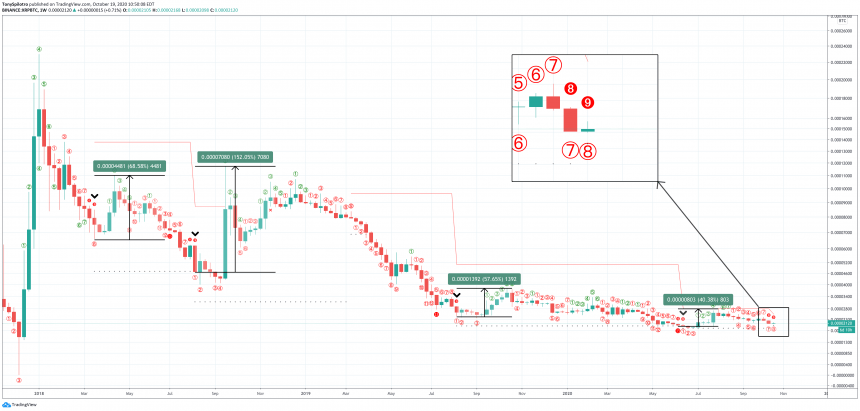
After a string of sideways price action, Ripple has fallen just enough to trigger a TD 9 “buy” setup on the TD Sequential indicator, on weekly timeframes.
The signal appears only on the Bitcoin trading pair, while the count on the USD pair just restarted. However, on daily timeframes, the USD pair triggered the same signal last week, but the upside that was expected to result is only just now beginning.
Related Reading | XRP Up-Move To Leave Bitcoin And Tether Traders “Sidelined”
The TD Sequential indicator is a market-timing indicator, used to predict when tops or bottoms are put in. The signal comes after a sequence of candles closer higher or lower than the previous, resulting in a buy or sell setup after a count of nine or thirteen.
The tool essentially is predicting, based on meeting certain price action requirements, that a reversal is likely. And it is, according to historic price data on the XRPBTC trading pair.

Weekly TD 9 Buy Setup Leads To Nearly 80% Returns On Average | Source: XRPBTC on TradingView.com
Ripple To Rally Against Bitcoin, Signal’s Past Performance Results In Nearly 80% Rise On Average
Since the bear market first began, XRPBTC has triggered four other “perfected” nine “buy” setups. The sell signal is “perfected” when the nine candle falls below the low point of the previous three candles, and it increases the likelihood of successful signals resulting.
The latest signal marks the fifth time XRPBTC has experienced a “TD 9 buy” on weekly timeframes, with the four previous times ranging in how strong the rally was.
Related Reading | Underdog Story: Why XRP Could Soon Outperform Bitcoin And Ethereum
The first in the series was also the first major rebound after the fall from its all-time high. XRP recovered 68% against BTC before ultimately dropping lower.
At the next low, XRP spiked over 150% against the top crypto asset. Then again fell against Bitcoin for the entire next year.
Another signal in late 2019 pushed XRP back up 57%, and the most recent signal sent the altcoin soaring 40%. Combined on average, this comes out to a potential 79% pump stemming from the TD 9 buy signal on weekly timeframes.
Featured image from Deposit Photos, Chart from TradingView.com

